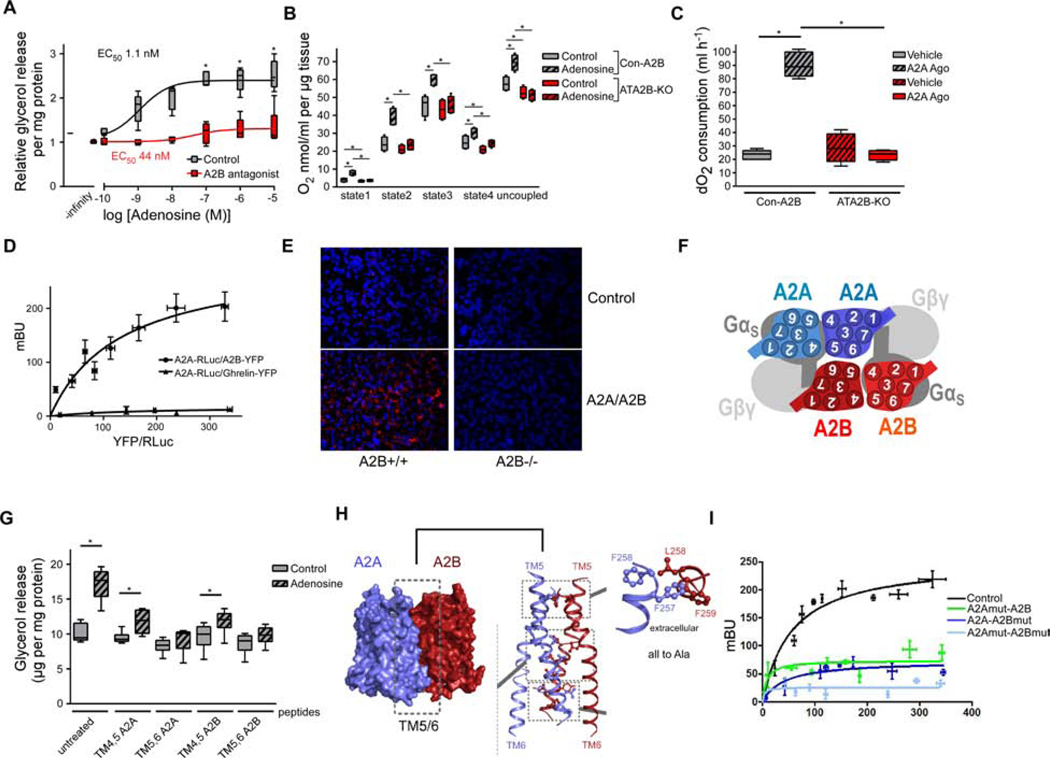
Figure 3. A2B heterodimerization. See also Figure S3.
(A) Lipolysis of murine BA treated with adenosine in the presence or absence of A2B antagonist (PSB603; 150 nM) (n=6). (B) O2 consumption of BAT explants deficient for A2B and treated with adenosine (1 μM) (n=6). ( C) O2 consumption of ATA2B-KO and Con-A2B mice injected with vehicle or A2A agonist (CGS21680; 1mg/kg) (n=5). (D) BRET analysis of A2A-RLuc and A2B-YFP or A2A-RLuc and Ghrelin-YFP in murine brown adipocytes (n=4). (E) Representative image after A2B/A2A proximity ligation assay in murine BAT. (F) In silico model of A2B/A2A interaction. (G) Lipolysis of murine BA treated with adenosine (1 μM) in the presence of indicated TM peptides (100 μM) (n=4). (H) In silico model of amino acid residues involved in A2B/A2A heterodimerisation. (I) A2B/A2A BRET after site-directed mutagenesis of residues identified in (H) (n=4). * P < 0.05. Data are shown as boxplot (with median) and whiskers (1.5x interquartile range) (A-C, G) or mean + SD (D,I) and analyzed using two-tailed student’s t-test (A) or ANOVA with Newman-Keuls post-hoc test (B,C,G).

