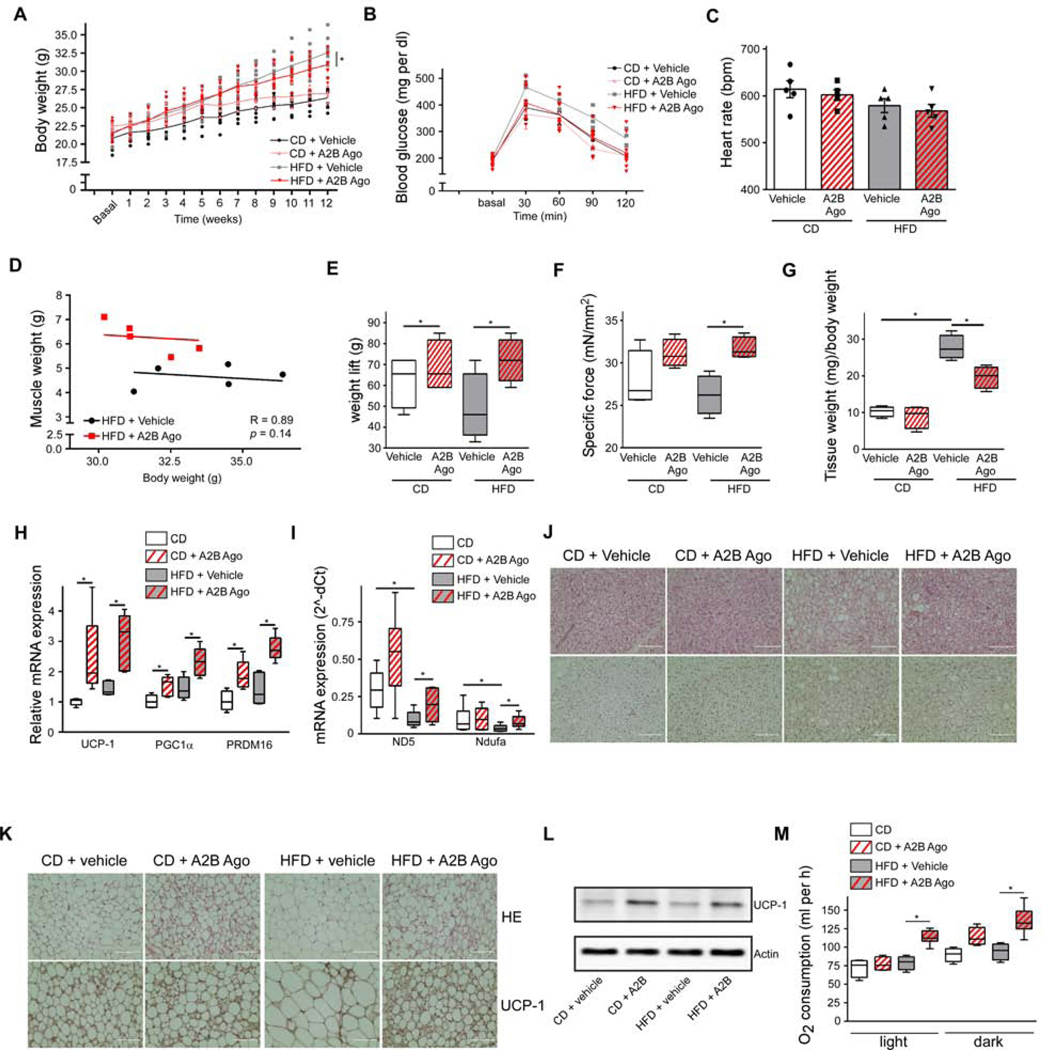
Figure 4. A2B-treatment counteracts DIO. See also Figure S4.
12-week DIO-study with A2B-stimulation: (A-M) Body weight (A), glucose tolerance (B), heart rate (C), correlation of muscle mass/body weight (D), weight lift (E), ex vivo specific muscle force (F), inguinal WAT mass (G), thermogenic (H) and mitochondrial (I) marker gene expression in BAT, representative HE (top) or UCP-1 (bottom) stain of BAT (J) and inguinal WAT sections (K) (Scale bar 100 μm), UCP-1 immunoblot of inguinal WAT ( L) and O2 consumption at 23° C ( M). See Figure 4A for body weight of the groups analyzed. n=5 per group. * P < 0.05. Data are shown as mean + SEM (A-C), scatter plot (D) or boxplot (with median) and whiskers (1.5x interquartile range) (E-I,M) and analyzed using ANCOVA (D) or ANOVA with Newman-Keuls post-hoc test (A,C,E-I,M).

