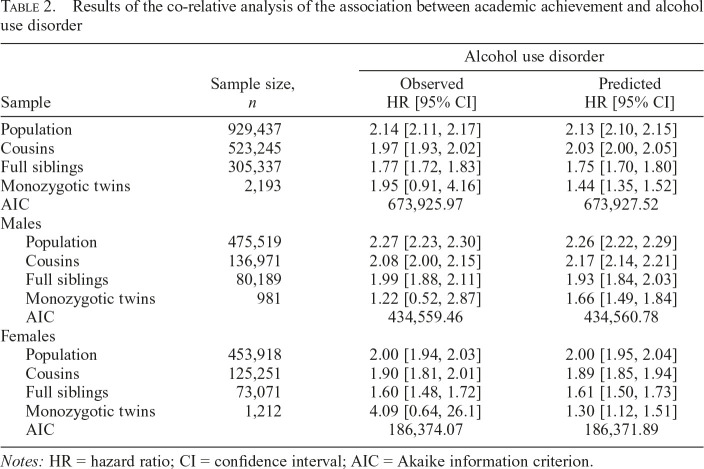
Table 2.
Results of the co-relative analysis of the association between academic achievement and alcohol use disorder
| Alcohol use disorder |
|||
| Sample | Sample size, n | Observed HR [95% CI] | Predicted HR [95% CI] |
| Population | 929,437 | 2.14 [2.11, 2.17] | 2.13 [2.10, 2.15] |
| Cousins | 523,245 | 1.97 [1.93, 2.02] | 2.03 [2.00, 2.05] |
| Full siblings | 305,337 | 1.77 [1.72, 1.83] | 1.75 [1.70, 1.80] |
| Monozygotic twins | 2,193 | 1.95 [0.91, 4.16] | 1.44 [1.35, 1.52] |
| AIC | 673,925.97 | 673,927.52 | |
| Males | |||
| Population | 475,519 | 2.27 [2.23, 2.30] | 2.26 [2.22, 2.29] |
| Cousins | 136,971 | 2.08 [2.00, 2.15] | 2.17 [2.14, 2.21] |
| Full siblings | 80,189 | 1.99 [1.88, 2.11] | 1.93 [1.84, 2.03] |
| Monozygotic twins | 981 | 1.22 [0.52, 2.87] | 1.66 [1.49, 1.84] |
| AIC | 434,559.46 | 434,560.78 | |
| Females | |||
| Population | 453,918 | 2.00 [1.94, 2.03] | 2.00 [1.95, 2.04] |
| Cousins | 125,251 | 1.90 [1.81, 2.01] | 1.89 [1.85, 1.94] |
| Full siblings | 73,071 | 1.60 [1.48, 1.72] | 1.61 [1.50, 1.73] |
| Monozygotic twins | 1,212 | 4.09 [0.64, 26.1] | 1.30 [1.12, 1.51] |
| AIC | 186,374.07 | 186,371.89 | |
Notes: HR = hazard ratio; CI = confidence interval; AIC = Akaike information criterion.

