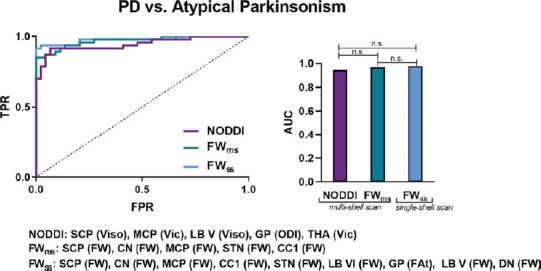
Figure 6.

Receiver operating curve analyses and corresponding area under the curve for each diffusion imaging model for differentiating Parkinson’s disease (PD) from atypical Parkinsonism (multiple-system anisotropy Parkinsonian variant and progressive supranuclear palsy).
Delong’s test was conducted to determine between-model differences. CC1: Corpus callosum prefrontal area; CN: caudate nucleus; DN: dentate nucleus; FWms: free water derived from the multishell scan; FAtms: free water-corrected fractional anisotropy derived from the multi-shell scan; FAtss: free water-corrected fractional anisotropy derived from the single-shell scan; FPR: false positive rate; FWss: free water derived from the single-shell scan; GP: globus pallidus; LBV: cerebellar lobule V; LB VI: cerebellar lobule VI; MCP: middle cerebellar peduncle; n.s.: not significant; ODI: orientation dispersion index; SCP: superior cerebellar peduncle; STN: subthalamic nucleus; THA: thalamus; TPR: true positive rate; Vic: intracellular volume fraction; Viso: isotropic volume fraction. Reproduced with permission from Mitchell et al., 2019.
