


Fig. 3.
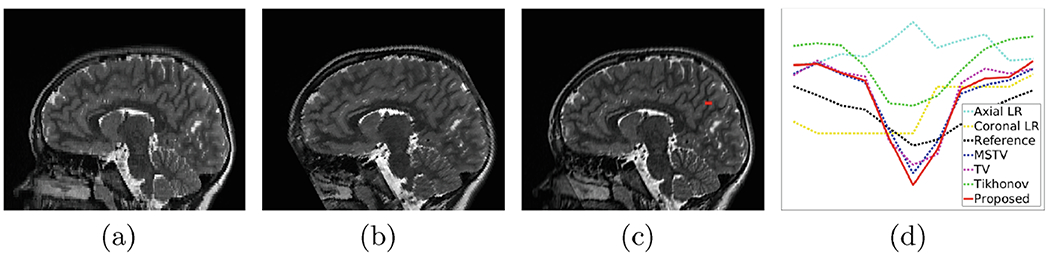
Reconstructed results on the AC data set. (a) A slice from the axial LR image. (b) A slice from the coronal LR image. (c) A slice form the reconstructed HR image by the proposed approach. (d) Edge profile plot over the line marked in red in (c). (Color figure online)