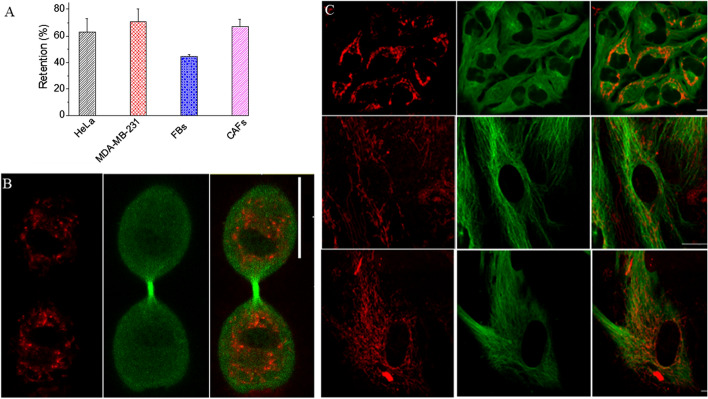
Fig. 6.
Quantitative and qualitative analysis of cellular retention of GNPPEG-RGD. a Quantitative data representing percent of retention of NPs. The cells were first incubated with NPs over a time period of 24 h followed by another incubation for 24 h in fresh media to determine the extent of NP retention. b Redistribution of GNPs in a parent cell among two daughter cells during cell division. c Confocal images of HeLa (first row), FBs (second row), and CAFs (third row) displaying distribution of GNPs (first column; marked in red), MT network (second column, marked in green), and merged image (third column) corresponding to GNPs and MTs. Experiments were repeated three times and the data presented are the average. The error bars represent standard error. Scale bar = 20 μm

