Fig. 7.
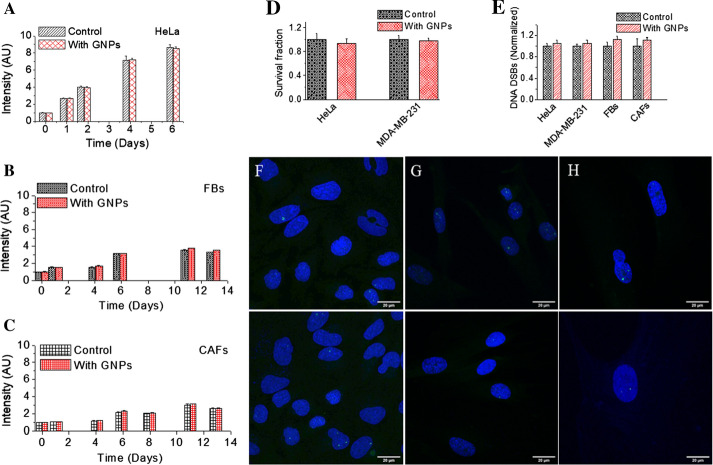
Evaluation of toxicity introduced by GNPs via probing of proliferation and DNA damage. a–c Cell proliferation as a function of time for HeLa, FBs, and CAFs, respectively. d Cell survival fraction measured using a clonogenic assay for HeLa and MDA-MB-231. e Comparison of DNA double strand breaks (DSBs) between control cells and ones treated with GNPs as measured using 53BP1 foci. f–h Projected confocal images of HeLa (first column), FBs (second column), and CAFs (third column), respectively. Nuclei and 53BP1 foci are marked in blue and green, respectively. Experiments were repeated three times and the data presented are the average of at least 50 nuclei. The error bars represent standard deviation. Scale bar = 20 µm

