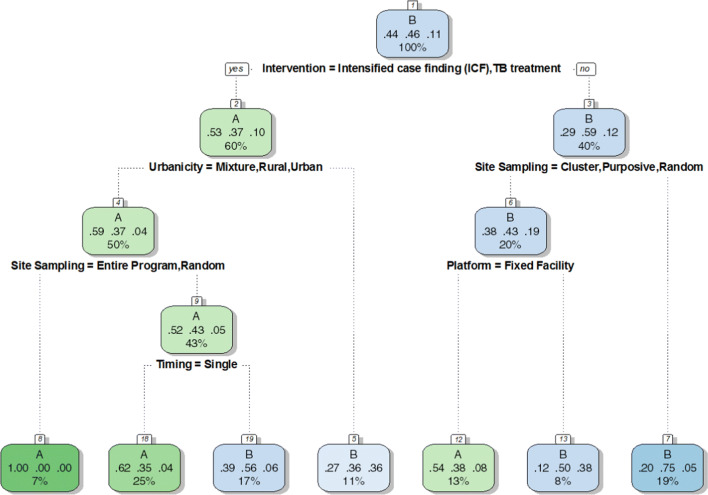
Fig. 1.
Classification tree. The label for the node reflects the dominant class—i.e. node 2 = A. The next set of numbers in the node are the proportion of the classes in the node—i.e. node 2 = 53% A, 37% B and 10% C (note the proportions here are conditional on the decisions that have already been made to reach that point in the tree). The final number in the node is the proportion of data in the node—i.e. node 2 = 60% of the data (40% falls in node 3)

