Supplemental Digital Content is available in the text
Keywords: osteoarthritis, synovial fibroblasts RNA-seq, key genes, gene ontology and Kyoto encyclopedia of genes and genomes
Abstract
Osteoarthritis (OA) is a chronic degenerative joint disease with its onset closely related to the growth of synovial fibroblasts (SFs), yet the genes involved in are few reported. In our study, we aimed to identify the OA-associated key gene and pathways via the single-cell RNA sequencing (scRNA-seq) analysis on SFs.
scRNA-seq data of SFs from OA sufferers were accessed from GEO database, then the genes involved in were subjected to principal component analysis (PCA) and T-Stochastic Neighbor Embedding (TSNE) Analysis. GO and KEGG enrichment analyses were performed to find the most enriched functions and pathways associated with marker genes and a PPI network was constructed to identify the key gene associated with OA occurrence.
Findings revealed that marker genes in three cell types identified by TSNE were mainly activated in pathways firmly related to fibroblasts growth, such as extracellular matrix, immune and cell adhesion molecule binding-associated functions and pathways. Moreover, fibronectin1 (FN1) was validated as the key gene that was tightly related to the growth of SFs, as well as had the potential to play a key role in OA occurrence.
Our study explored the key gene and pathways associated with OA occurrence, which were of great value in further investigation of OA diagnosis as well as pathogenesis.
1. Introduction
Osteoarthritis (OA) is a common chronic degenerative joint disease[1,2] especially prevalent in middle-aged population, with around 100 million sufferers[3] at present and approximately 40% over 70 years old.[3,4] It is worth noting that the morbidity of OA increases with age,[2,4] and females are more likely to be succumbed to such disease relative to males.[3] In clinic, the therapeutic approaches against OA are predominantly pain control, malformation correction, and joint function improvement or recovery, but the overall efficacy remains poor.[2,5] Therefore, more attention has been paid on the investigation of OA pathogenesis and further exploration in control measures, as well, mining OA-related genes has in turn become a focus in OA studies.
Synovial fibroblasts (SFs) which play an important role in OA occurrence are direct effectors responding to tissue damage and matrix remodeling in synovitis, and synovial cell activation is triggered by the synovial cell-leucocyte interaction as well as cell-cell contact via the cytokine network.[3] Besides, SFs can facilitate OA development via releasing inflammatory factors. Thus, to extend our knowledge of OA occurrence and the key genes involved in, it is of great guiding significance to clarify the mechanism underlying SFs occurrence and development as well as identify the associated genes.
To date, several important regulatory genes have been identified during the research on SFs. Day-Williams et al found that MCF2L could function on the apoptosis of SFs through interacting with NRAGE, NRIF, NADE and other genes, thereby affecting OA progression.[6] IL-13 has been identified as an important player in SFs via reducing the expression levels of cytokines and metalloproteinase, as reported by Jovanovic et al[7] The discovery of these genes lays foundation for the further research on the mechanism of SFs occurrence, yet few studies have been made on the key genes that are associated with SFs and OA. With the development of RNA sequencing (RNA-seq) and single-cell sequencing techniques, most key genes associated with the occurrence of diseases and physiological processes can be identified. For example, Hu et al applied single-cell RNA sequencing (scRNA-seq) technique and revealed that some autophagy-related genes served as important players during the formation of mouse embryonic hematopoietic stem cells.[8] Sun et al discovered some extracellular matrix (ECM)-associated genes which were crucial for breast cancer endothelial cells, and some of them had the potential acting as biomarkers in various cancers.[9] Collectively, scRNA-seq analysis for identification of key genes associated with disease occurrence can be used as a significant approach for the investigation of the mechanism underlying cancer occurrence.
In the present study, scRNA-seq data of SFs in OA sufferers were accessed from GEO database, and then genes involved in were processed for Principal Component Analysis (PCA) and T-Stochastic Neighbor Embedding (TSNE) analysis. Gene Ontology (GO), Kyoto Encyclopedia of Genes and Genomes (KEGG) and protein-protein interaction (PPI) network were eventually employed to identify the key genes and pathways that were firmly associated with OA occurrence.
2. Materials and Methods
2.1. Data processing
In total, 192 scRNA-seq files of SFs from 2 OA patients were accessed from microarray GSE109449 included in Gene Expression Omnibus (GEO) database (https://www.ncbi.nlm.nih.gov/geo/). Then statistical analysis was conducted with respect to gene number and expression levels.
2.2. Principal component analysis (PCA) and T-stochastic neighbor embedding (TSNE) analysis
Data fitting and R package were applied to perform PCA and TSNE analyses, as previously reported by Stuart et al[10] and Butler[11] et al.
2.3. Construction of protein-protein interaction (PPI) network
PPI network was constructed using STRING database (https://string-db.org/), and nodes associated to each gene were counted.
3. Results
3.1. Analysis on scRNA-seq of SFs
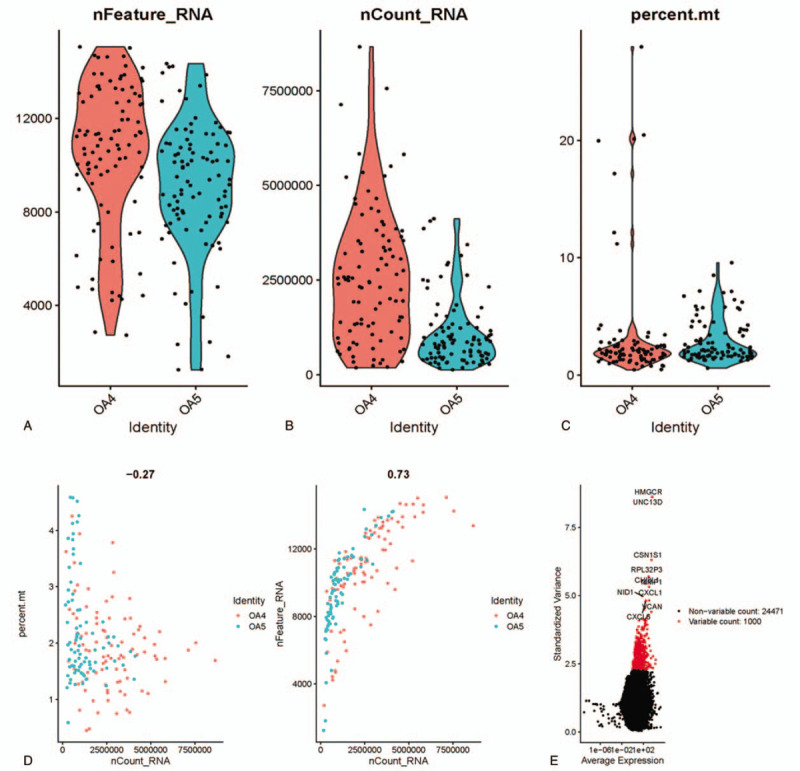
In all, scRNA-seq data of 192 SFs from 2 OA patients (OA4 and OA5) were obtained from microarray GSE109449 recorded in GEO database. Three aspects were selected for data analysis, including gene number in each cell (nFeature), total count number of all genes in each cell (nCount) and percentage of mitochondrial gene number in total gene number in each cell (percent.mt). As shown in Figure 1A–C nFeature was over 50 in every cell, whereas nCount of most cells was smaller than 5,000,000, and percent.mt was predominantly lower than 10%. As the expression of mitochondrial gene is generally low, cells with nFeature > 50 and percent.mt<5% were selected for subsequent analysis. Correlation analysis was performed on nCount and percent.mt or nFeature, finding a negative correlation between nCount and percent.mt, but a positive correlation between nCount and nFeature (Fig. 1D). This result further elucidated the low expression of genes in mitochondria. Thereafter, scatter diagram was plotted to find genes with larger expression alteration in different cells (Fig. 1E), and the top 1000 were selected for follow-up analysis.
Figure 1.

Analysis on scRNA-seq data of SFs. scRNA-seq data of 192 SFs from 2 OA sufferers (OA4 and OA5) were accessed from GSE109449 and then analyzed in (A) nFeature, (B) nCount and (C) percent.mt three aspects, as shown in violin plots. Then, correlation analysis was performed on (D, left) nCount and percent.mt as well as on (D, right) nCount and nFeature, and (E) scatter diagram was plotted to find genes with larger expression alteration in different cells, with the abscissa referring to average expression, the vertical axis referring to standardized variance, black pots meaning the genes ranking after 1000 while red pots meaning the genes ranking top 1000.
3.2. PCA and TSNE analysis
In order to identify the marker genes from the top 1000 genes screened before, PCA was conducted and 20 principal components (PCs) were obtained. As revealed in the cell distribution in the top 2 PCs (PC1 and PC2) in Figure 2A, discreteness was obviously observed, indicating that PCA analysis could achieve the purpose of dimensionality reduction and cell classification. Then, cluster analysis was performed on the cells in these 20 PCs, and eventually three PCs with the most significant difference were identified, including PC1, PC2, and PC3 (Fig. 2B). Subsequently, cells in these 3 PCs were classified into 4 types (type 0, 1, 2, and 3) via TSNE analysis (Fig. 2C), genes among which were then differentially analyzed for marker genes identification (log|FC| > 0.5, P value < .05). Due to the distant relationship among cell type 1, 2 and 3, marker genes that were significantly different in these three types were chosen for follow-up enrichment analysis.
Figure 2.

PCA and TSNE analyses. (A) The 1000 variant genes screened before were analyzed by PCA, and eventually 20 PCs were obtained. Then (B) the 20 PCs were clustered, ultimately 3 PCs with most significant difference was identified. The abscissa represents empirical value and the vertical axis represents theoretical value. In turn, (C) cells in these 3 PCs were sequentially clustered into four types via TSNE analysis.
3.3. GO and KEGG enrichment analyses
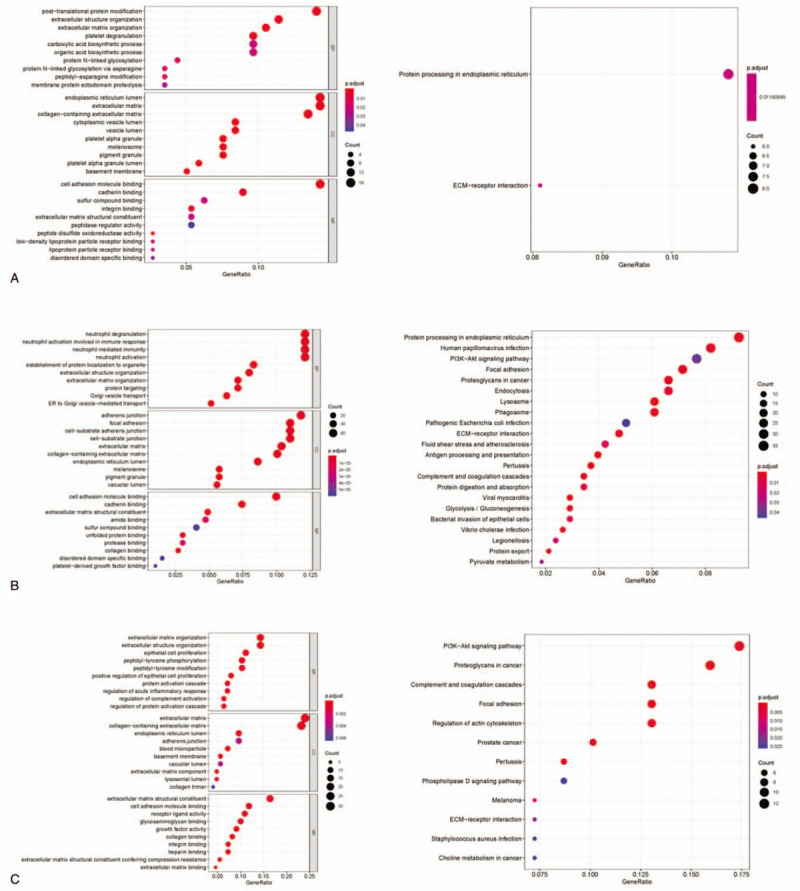
GO and KEGG enrichment analyses were carried out on the marker genes identified from cell type 1, 2, and 3. The results demonstrated that genes in type 1 were mainly activated in functions related to extracellular structure organization, ECM organization and cell adhesion molecule binding (Fig. 3A), as well as enriched in ECM-receptor interaction pathway. Other than the functions and the pathway that type 1 genes activated in, genes in type 2 were also enriched in some immune-related functions like neutrophil degranulation and neutrophil mediated immunity (Fig. 3B), as well as some signaling pathways like PI3K-AKt. While for genes in type 3, the most enriched functions were similar to those of type 1 genes (Fig. 3C), yet pathways genes activated in were predominantly PI3K-AKt and ECM-receptor interaction pathways. Taken together, despite the most consistency in enriched functions and pathways of genes in these three types, a certain difference was still present among diverse cell types.
Figure 3.

GO and KEGG enrichment analyses. GO (left) and KEGG (right) were conducted to analyze the most enriched functions and pathways of genes in cell type (A) 1, (B) 2 and (C) 3.
3.4. Selection of feature genes in TSNE cell types
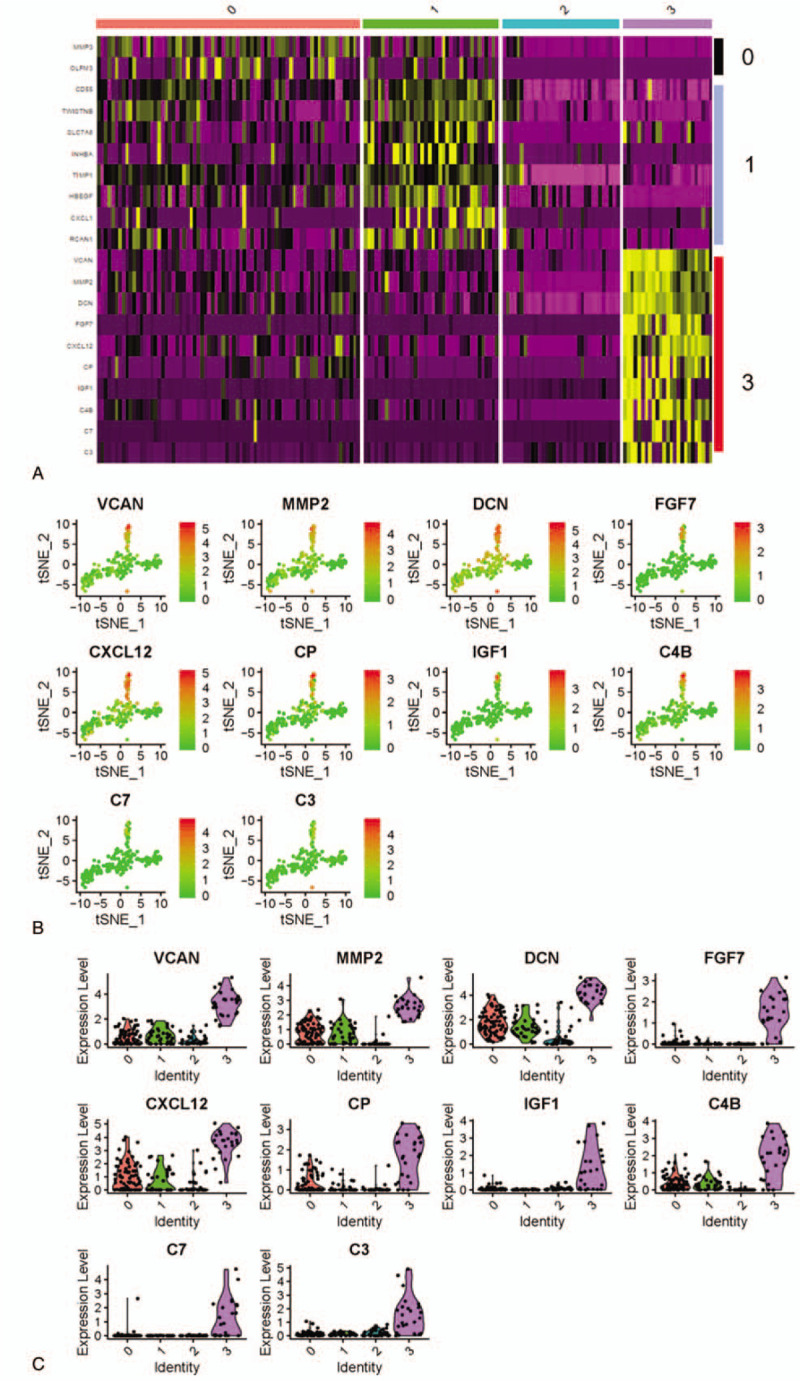
To better identify the feature genes with remarkable expression features in cells, the top 10 marker genes in each cell type were selected according to the log|FC| value (Supplementary Table 1). Seurat 3.0 (https://satijalab.org/seurat/) was used to normalize and visualize the expression of the total 40 marker genes, and finally 20 marker genes with significantly differential expression were screened (Fig. 4A). Statistically, 10 marker genes in cell type 3 were obviously increased relative to those in the other 3 types cells, which demonstrated the more remarkable expression heterogeneity of the marker genes in type 3. Thereafter, the expression levels of the 10 marker genes in four types were extracted for visualization analysis, showing that the expression levels of the 10 genes in type 3 cells were greatly higher than those in the other 3 types cells (Fig. 4B and C). Taken together, all findings elucidated that marker genes in TSNE type 3 had much more significant expression difference relative to other types genes, as well, feature genes associated with SFs growth were more likely to appear among these genes.
Figure 4.

Selection of significantly variant marker genes in TSNE cell types. The expression levels of variant genes in four cell types were plotted in a (A) heatmap, with purple as low expression genes and yellow as high expression genes. The abscissa represents the cells in type 0, 1, 2, and 3, while genes on the vertical axis represent the marker genes of four cell types that were normalized using Seurat 3.0. 10 marker genes of type 3 were analyzed in (B) expression in type 3 cells, with red meaning low expression and green meaning high expression. Then (C) these genes were analyzed in all 4 cell types, with abscissa referring to cell types and vertical axis referring to expression levels.
3.5. Construction of PPI network and identification of key genes
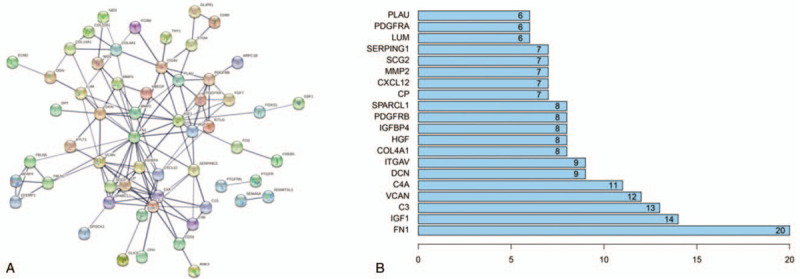
Marker genes in cell type 3 were projected onto a PPI network using STRING website. As plotted in Figure 5A, all these marker genes showed a certain correlation with some genes in the network, which revealed that these marker genes might affect SFs via mutual adjustment. In addition, FN1 was found to possess the maximum node numbers (Fig. 5B), thus, it had the potential to function on the growth of SFs, consequently making an impact on OA occurrence.
Figure 5.

Construction of PPI network and identification of the key gene. Marker genes in TSNE cell type 3 were projected onto (A) a PPI network and analyzed in (B) node number. The abscissa presented as node number.
4. Discussion
scRNA-seq is a technique combined with single-cell separation and RNA-seq methods, with the latest progress as detailed quantitative analysis on studied transcripts for the expression detection of all genes in thousands of separated cells at the single-cell level.[12] In the past several years, single-cell cDNA libraries have been constructed, where scholars have the chance to obtain scRNA-seq data of the sequenced samples from relevant databases, in turn exploring the targeted key genes and pathways via analysis on related genes from the multi-dimension and multi-feature aspects.[13,14] This study, for the first time, focused on the SFs of OA for gene analysis. scRNA-seq data of totally 192 SFs from 2 OA patients were accessed from GEO database, and the cells involved in were analyzed in nFeature, nCount and percent.mt three aspects. Consequently, 1000 genes with larger expression variance in different cells and had a high expression except in mitochondria were identified.
PCA, a conditional screening method for various genes with differential expression, has been often used for dimensionality reduction of genes in the scRNA-seq research.[9,14] In the present study, PCA was performed on the genes associated with SFs for the first time, and 3 PCs with significant difference were identified, cells among which were sequentially classified into 4 types via TSNE clustering analysis. GO and KEGG analyses were conducted on the marker genes from the 3 cell types, finding that functions and pathways genes activated in were predominantly ECM, immune as well as cell adhesion molecule binding-related functions and pathways, which are firmly associated with the occurrence of fibroblasts.[15,16] Collectively, the results indicated the successful identification of genes and corresponding enrichment pathways closely related to SFs.
After enrichment analysis, marker genes of cell type 3 (with great difference in expression with other cell types) were projected onto a PPI network, and FN1 was seen to be the key gene. FN1 (fibronectin1) is a vital component of ECM with a diversity of functions, such as accelerating blood clotting, possessing chemotaxis in neutrophil and monocyte, potentiating the movement of fibroblasts and chondrocytes to the injury, and participating in a series of physiological and pathological processes including transduction as well as activation of cell signals, cell growth and differentiation, and wound healing.[15] Many studies have reported that the alteration of FN1 mRNA is tightly correlated with the OA occurrence.[17,18] In the present study, FN1 was eventually determined as the key gene associated with OA occurrence via gene analysis in SFs of OA sufferers, supporting its important role in OA occurrence.
In conclusion, a series of analyses were performed on the scRNA-seq data of SFs in OA sufferers, and identified that OA occurrence-related genes were mainly enriched in ECM, immune and cell adhesion molecule binding-related functions and pathways. In addition, FN1 was considered as the key gene functioning in OA occurrence. Meanwhile, some limitations were appeared in our study. For instance, the scRNA-seq data were only treated with one method of dimensionality reduction for gene screening, which needs further improvement. In a word, our study provides a novel research object for OA pathogenesis, and helps to explore a potential therapeutic target for OA.
5. Strengths and limitations of this study
The key pathways associated with osteoarthritis were firstly identified through single-cell RNA sequencing;
The protein-protein interaction (PPI) network of osteoarthritis-associated genes was constructed for the first time.
The key gene and pathways associated with osteoarthritis occurrence were identified and were of great value in further investigation of osteoarthritis diagnosis as well as pathogenesis.
Author contributions
Zhen Wu, Lu Shou, Jian Wang and Xinwei Xu contributed to the study design. Zhen Wu, Lu Shou and Xinwei Xu conducted the literature search. Zhen Wu, Lu Shou, Jian Wang and Xinwei Xu acquired the data. Zhen Wu, Lu Shou, Jian Wang and Xinwei Xu wrote the article and performed data analysis. All authors gave the final approval of the version to be submitted. All authors read and approved the final manuscript.
Supplementary Material
Footnotes
Abbreviations: ECM = extracellular matrix, FN1 = fibronectin1, GO = Gene Ontology, GEO = gene expression omnibus, KEGG = Kyoto Encyclopedia of Genes and Genomes, OA = osteoarthritis, PCA = principal component analysis, PCA = principal component analysis, PCs = principal components, PPI = protein-protein interaction, PPI = protein-protein interaction, RNA-seq = RNA sequencing, TSNE = T-stochastic neighbor embedding, TSNE = T-Stochastic Neighbor Embedding, TSNE = T-Stochastic Neighbor Embedding, scRNA-seq = the single-cell RNA sequencing, SFs = synovial fibroblasts.
How to cite this article: Wu Z, Shou L, Wang J, Xu X. Identification of the key gene and pathways associated with osteoarthritis via single-cell RNA sequencing on synovial fibroblasts. Medicine. 2020;99:33(e21707).
The data used to support the findings of this study are publicly available.
Ethical approval was not necessary in this research because it's a bioinformation analysis which refers to downloading data on related pathological species from the Gene Expression Omnibus (GEO) database (https://www.ncbi.nlm.nih.gov/geo/).
The authors have no funding and conflicts of interest to disclose.
The datasets generated during and/or analyzed during the current study are publicly available.
References
- [1].Pu P, Qingyuan M, Weishan W, et al. Protein-degrading enzymes in osteoarthritis. Z Orthop Unfall 2019. [DOI] [PubMed] [Google Scholar]
- [2].Costello CA, Hu T, Liu M, et al. Metabolomics Signature for Non-Responders to Total Joint Replacement Surgery in Primary Osteoarthritis Patients: The Newfoundland Osteoarthritis Study. J Orthop Res 2020;38:793–802. [DOI] [PubMed] [Google Scholar]
- [3].Cornelis FM, Luyten FP, Lories RJ. Functional effects of susceptibility genes in osteoarthritis. Discov Med 2011;12:129–39. [PubMed] [Google Scholar]
- [4].Dieppe PA, Lohmander LS. Pathogenesis and management of pain in osteoarthritis. Lancet 2005;365:965–73. [DOI] [PubMed] [Google Scholar]
- [5].Mehl J, Imhoff AB, Beitzel K. Osteoarthritis of the shoulder: pathogenesis, diagnostics and conservative treatment options. Orthopade 2018;47:368–76. [DOI] [PubMed] [Google Scholar]
- [6].Day-Williams AG, Southam L, Panoutsopoulou K, et al. A variant in MCF2L is associated with osteoarthritis. Am J Hum Genet 2011;89:446–50. [DOI] [PMC free article] [PubMed] [Google Scholar]
- [7].Jovanovic D, Pelletier JP, Alaaeddine N, et al. Effect of IL-13 on cytokines, cytokine receptors and inhibitors on human osteoarthritis synovium and synovial fibroblasts. Osteoarthr Cartil 1998;6:40–9. [DOI] [PubMed] [Google Scholar]
- [8].Hu Y, Huang Y, Yi Y, et al. Single-cell RNA sequencing highlights transcription activity of autophagy-related genes during hematopoietic stem cell formation in mouse embryos. Autophagy 2017;13:770–1. [DOI] [PMC free article] [PubMed] [Google Scholar]
- [9].Sun Z, Wang CY, Lawson DA, et al. Single-cell RNA sequencing reveals gene expression signatures of breast cancer-associated endothelial cells. Oncotarget 2018;9:10945–61. [DOI] [PMC free article] [PubMed] [Google Scholar]
- [10].Chen L, Yuan L, Qian K, et al. Identification of biomarkers associated with pathological stage and prognosis of clear cell renal cell carcinoma by co-expression network analysis. Front Physiol 2018;9:399. [DOI] [PMC free article] [PubMed] [Google Scholar]
- [11].Butler A, Hoffman P, Smibert P, et al. Integrating single-cell transcriptomic data across different conditions, technologies, and species. Nat Biotechnol 2018;36:411–20. [DOI] [PMC free article] [PubMed] [Google Scholar]
- [12].Pollen AA, Nowakowski TJ, Shuga J, et al. Low-coverage single-cell mRNA sequencing reveals cellular heterogeneity and activated signaling pathways in developing cerebral cortex. Nat Biotechnol 2014;32:1053–8. [DOI] [PMC free article] [PubMed] [Google Scholar]
- [13].Wilkinson DJ. Stochastic modelling for quantitative description of heterogeneous biological systems. Nat Rev Genet 2009;10:122–33. [DOI] [PubMed] [Google Scholar]
- [14].Wilhelm BT, Marguerat S, Watt S, et al. Dynamic repertoire of a eukaryotic transcriptome surveyed at single-nucleotide resolution. Nature 2008;453:1239–43. [DOI] [PubMed] [Google Scholar]
- [15].Shaoul E, Reich-Slotky R, Berman B, et al. Fibroblast growth factor receptors display both common and distinct signaling pathways. Oncogene 1995;10:1553–61. [PubMed] [Google Scholar]
- [16].Satish L, Babu M, Tran KT, et al. Keloid fibroblast responsiveness to epidermal growth factor and activation of downstream intracellular signaling pathways. Wound Repair Regen 2004;12:183–92. [DOI] [PubMed] [Google Scholar]
- [17].Kriegsmann J, Berndt A, Hansen T, et al. Expression of fibronectin splice variants and oncofetal glycosylated fibronectin in the synovial membranes of patients with rheumatoid arthritis and osteoarthritis. Rheumatol Int 2004;24:25–33. [DOI] [PubMed] [Google Scholar]
- [18].Sun Y, Lv M, Zhou L, et al. Enrichment of committed human nucleus pulposus cells expressing chondroitin sulfate proteoglycans under alginate encapsulation. Osteoarthr Cartil 2015;23:1194–203. [DOI] [PubMed] [Google Scholar]
Associated Data
This section collects any data citations, data availability statements, or supplementary materials included in this article.


