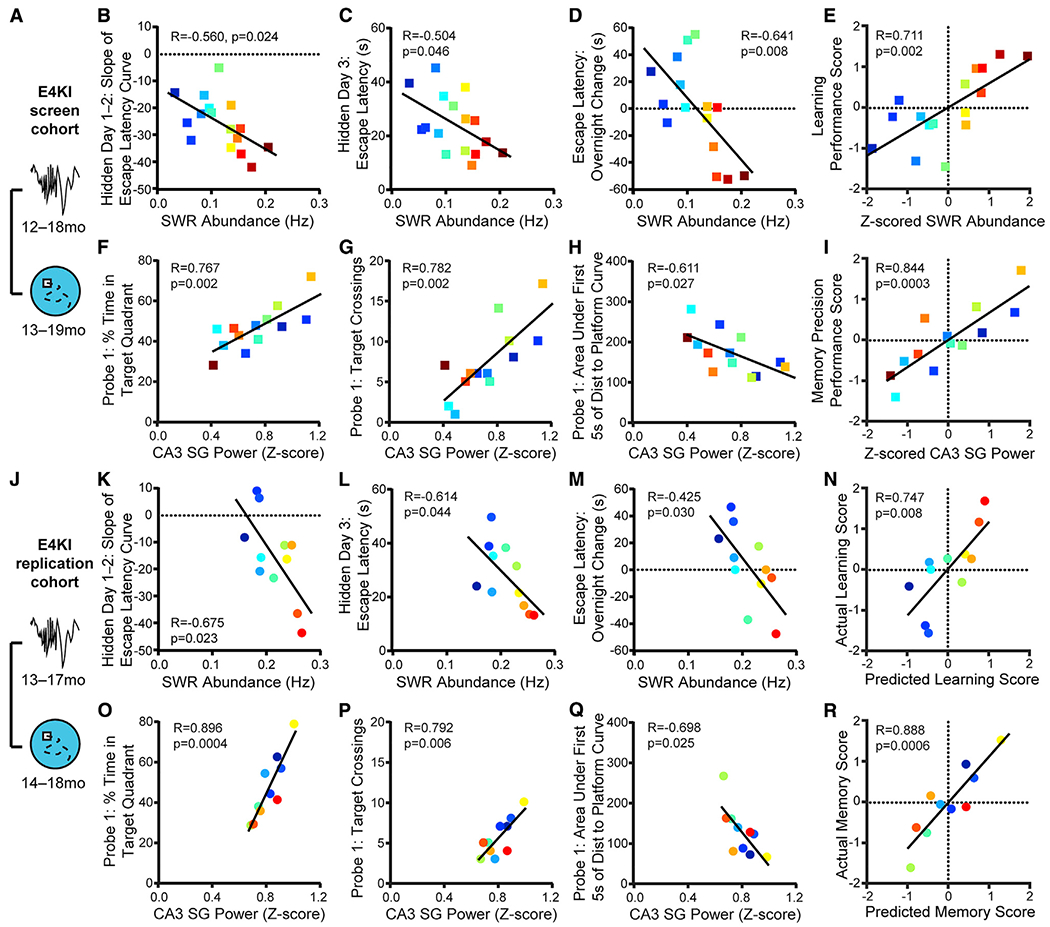
Figure 2. SWR Deficits Predict Spatial Approach Task Impairments in Aged apoE4-KI Mice.

(A) Timeline of experiments shown in (B)–(I).
(B–D) SWR abundance predicts (B) slope ofescape latency over hidden days 1–2 (F(1,14) = 6.41), (C) averageescape latencyon hidden day 3 (F(1,14) = 4.77), and (D) change in escape latency between the last trial of hidden day 1 and the first trial of hidden day 2 (F(1,14) = 9.76); n = 16 mice.
(E) Z-scored SWR abundance predicts learning performance score (F(1,14) = 14.3); n = 16 mice.
(F–H) CA3 SG power during SWRs predicts (F) percent time spent in quadrant that previously contained the platform (F(1,11) = 15.75), (G) number of times crossing the previous platform location (F(1,11)= 17.3), and (H) area under the curve of the distance to the prior platform location during the first 5 s of probe 1 (F(1,11) = 6.55); n = 13 mice.
(I) Z-scored CA3 SG power during SWRs predicts memory precision performance score (F(1,11) = 27.3); n = 13 mice.
In (B)–(I), apoE4-KI mice aged 12–18 months at electrophysiological recording and 13–19 months at MWM.
(J) Timeline of experiments shown in (K)–(R).
(K–M) In a replication experiment in a separate cohort of animals, SWR abundance predicts (K) slope of escape latency over hidden days 1–2 (F(1,9) = 7.51, adjusted p = 0.067), (L) average escape latency on hidden day 3 (F(1,9) = 5.45, adjusted p = 0.044), and (M) change in escape latency between the last trial of hidden day 1 and the first trial of hidden day 2 (F(1,9) = 6.66, adjusted p = 0.059); n = 11 mice.
(N) Learning performance score as predicted by the linear model in (E) predicts actual learning performance score (F(1,9) = 11.4); n = 11 mice.
(O–Q) In a replication experiment in a separate cohort of animals, CA3 SG power during SWRs predicts (O) percent time spent in quadrant that previously containedthe platform (F(1,8) = 32.64, adjusted p = 0.002), (P) numberoftimescrossing the previous platform location (F(1,8) = 13.48, adjusted p = 0.025), and (Q) area under the curve of the distance to the prior platform location during the first 5 s of probe (F(1,8) = 7.61, adjusted p = 0.049); n = 10 mice.
(R) Memory precision performance score as predicted by the linear model in (I) predicts actual memory precision performance score (F(1,8) = 30.1); n = 10 mice. In (K)–(R), apoE4-KI mice aged 13–17 months at electrophysiological recording and 14–18 months at MWM. Multiplicity adjusted p values with the Holm-Sidak method.
Pearson correlations of apoE4-KI mice. Points colored in order of SWR abundance from blue (lowest) to red (highest). Results drawn from 2 independent experiments.
See also Figures S1 and S2.
