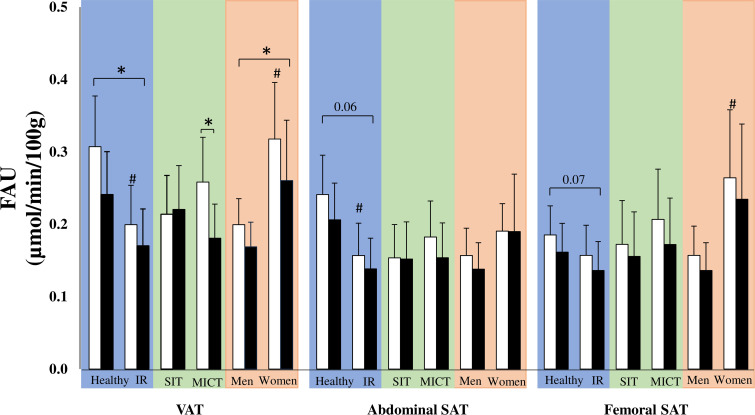
Figure 6.
Fasting free fatty acid uptake (FAU) per 100 g of the tissue before (white bars) and after (black bars) the training intervention in visceral adipose tissue (VAT), abdominal subcutaneous adipose tissue (SAT) and femoral SAT. Glucose uptake is compared in three different comparisons: healthy versus insulin-resistant (IR) men (blue), sprint interval training (SIT) versus moderate-intensity continuous training (MICT) in IR participants (green) and men versus women in IR participants (red). All data are expressed as means and 95% CIs. #p<0.05: difference at baseline. *p<0.05: the effect of exercise training over time in the whole group or a subgroup. Model-based means together with 95% CIs are presented.

