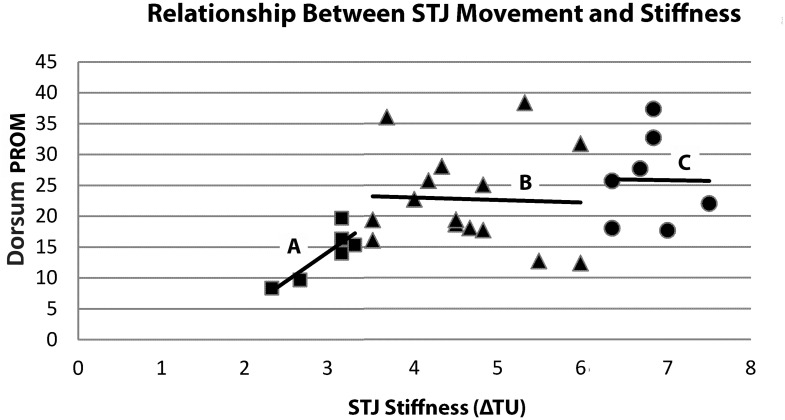
Fig 4. Scatter plot of STJ Stiffness (ΔTU) and dorsum PROM (degrees) values.
Squares = Increased stiffness with a significant and meaningful correlation (r = .853,p = .031,n = 6; adjusted R2 = 0.659) with corresponding line-of-best-fit (A); Triangles = Normal stiffness group with a poor and non-significant relationship (r = -.042,n = 15,p = .882,R2 = .002) with corresponding line-of-best-fit (B); and Circles = Decreased stiffness group with a poor and non-significant relationship (r = -.014,n = 7,p = .977,R2 = .0002) with corresponding line-of-best-fit (C).

