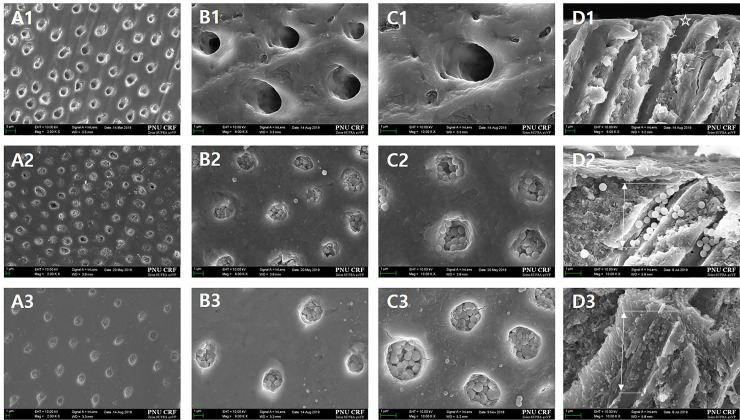
Fig 11.
FESEM micrographs of the top and longitudinal sections of the hypersensitive tooth model to confirm the tubule-occluding effect in each group (A, x2,000; B, x6,000; C, x10,000; D, sagittal). There is no smear layer in the dentinal tubule in the A1–D1 images of Group 1 (control) (*). The image of Group 2 (Dense BGN) shows a partially occluded dentinal tubule at 4–5 μm depth (arrow). The image of Group 3 (MBGN) shows a partially occluded dentinal tubule at 5–6 μm depth (arrow).

