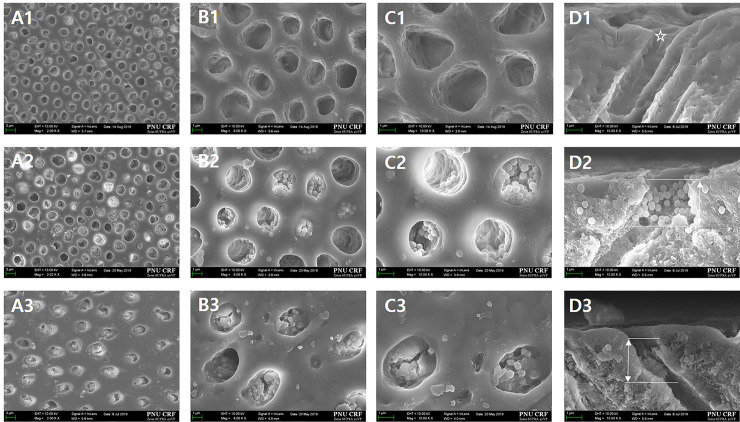
Fig 12.
FESEM micrographs of the top and FESEM micrographs to examine the tubule-occluding effects in the hypersensitive tooth model after 1 min exposure to 6 wt.% citric acid (A, x2,000; B, x6,000; C, x10,000; D, sagittal). A1–D1 images of Group 1 (control) show that the diameter of the dentinal tubule increased (*). The image of Group 2 (dense BGN) shows that the concentration and depth of particles blocking the dentinal tubule have decreased. The image of Group 3 (MBGN) shows that there is a lower concentration of particles blocking the dentinal tubule and that the depth within the tubule has also decreased. Compared to those in Group 2, the particles in Group 3 aggregated and formed a membrane-like layer or box.

