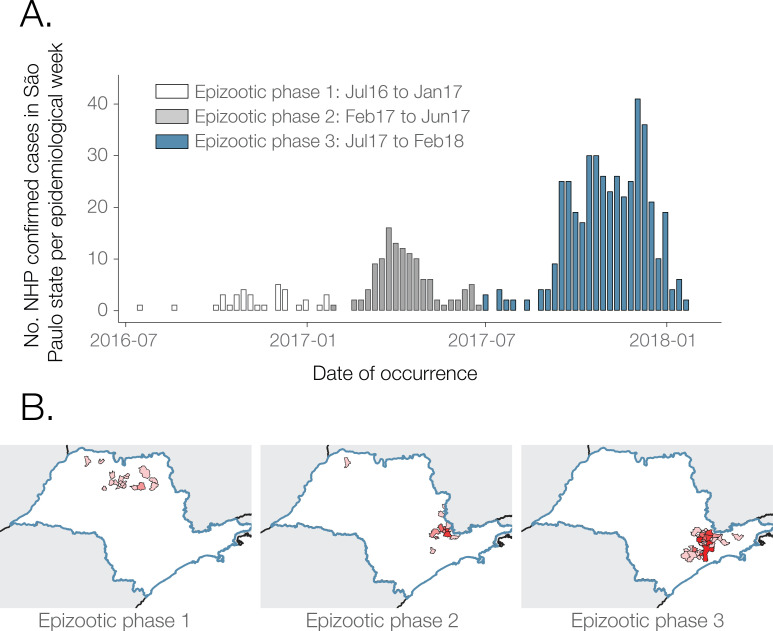
Fig 1. Distribution of weekly YFV cases.
A). NHP YFV positive confirmed cases per week. B). Choropleth map of São Paulo municipalities reporting positive NHP YFV cases during each outbreak phase. Shapefiles used to produce these maps are freely available from the Brazilian Institute of Geography and Statistics (IBGE) [42].

