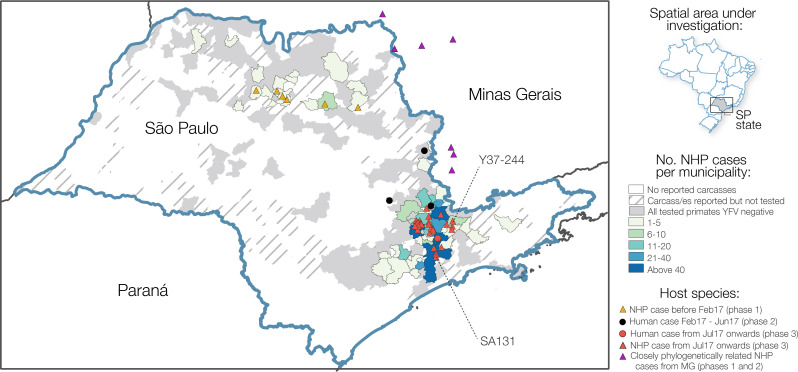
Fig 2. Choropleth map of the distribution of confirmed NHP cases per municipality in São Paulo state between July 2016 and February 2018.
Municipalities are shaded based on reporting and testing of NHPs. Circles depict locations of those cases from humans that were sequenced as part of this study, and red and orange triangles depict locations in São Paulo state from which NHP genome sequences were sequenced as part of this study. Eight samples from 7 municipalities in MG that form a clade with our sequences from São Paulo and that were sequenced by previous studies [8,43] are shown in purple triangles. Samples SA131 and Y37-244 are indicated. Shapefiles used to produce this maps are freely available from the Brazilian Institute of Geography and Statistics (IBGE) [42].

