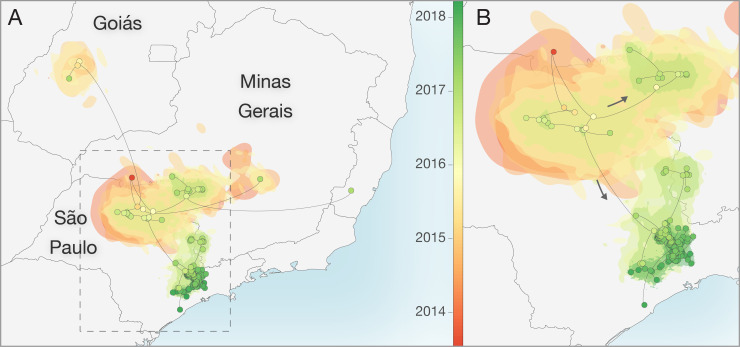
Fig 4. Reconstructed spatiotemporal diffusion of YFV in São Paulo.
Phylogenetic branches are mapped in space according to the location of phylogenetic nodes and tips (circles). Shaded regions coloured according to time show 80% highest posterior density contours calculated using bivariate kernel density estimation of the location of all nodes observed within defined 6-month time intervals in a subset of 1000 trees. Illustrated nodes are from the MCC tree and are coloured according to time. A) Spatiotemporal diffusion of taxa based on analysis of the full dataset (n = 99 sequences). B) Expansion of region highlighted in A without the long-distance outlier sequences. Shapefiles used to produce this map are available in the public domain from Natural Earth (https://www.naturalearthdata.com/).

