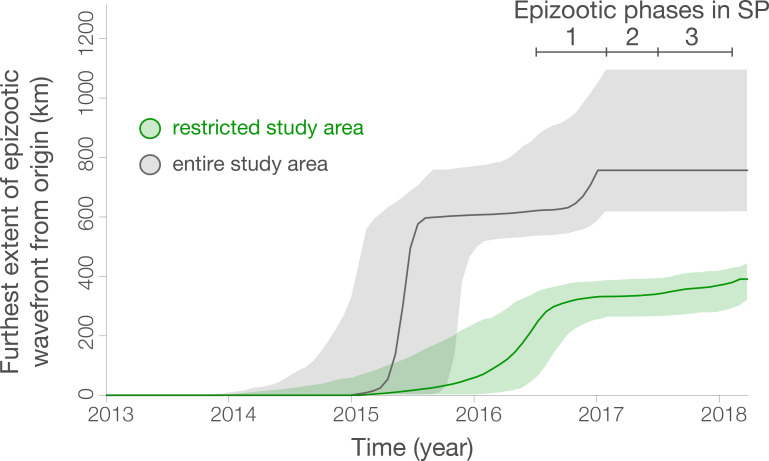
Fig 6.
Spatial wavefront distance from epidemic origin over time for all studied sequences (grey), and those in the restricted area shown in Fig 4B (green), as estimated with the “seraphim” package. The identified epizootic phases are indicated by bars in the upper right. Ribbons show 95% HPDs.

