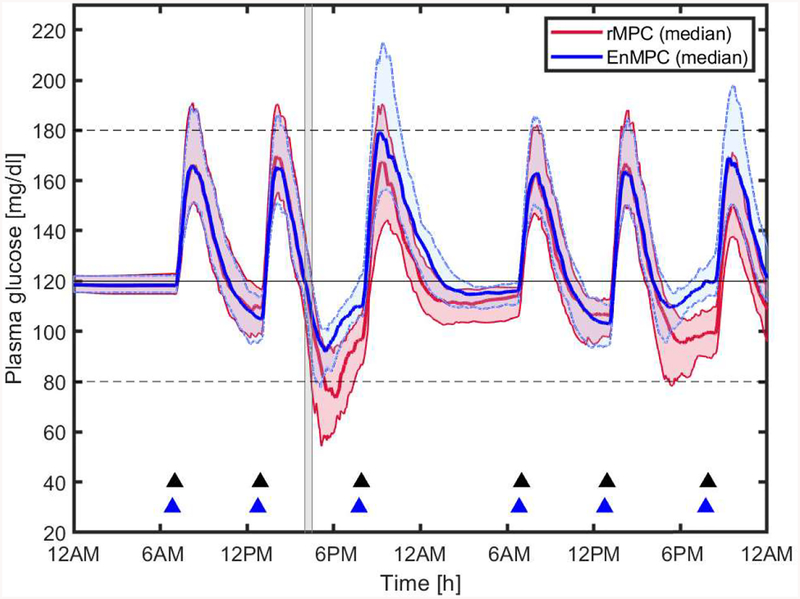
Figure 6:
Blood Glucose control performance of rMPC (baseline) and EnMPC Median and Interquartile BG plot for 50 virtual subjects from the UVA/Padova Simulator. Solid black line represents the set point (120 mg/dL), dotted black lines the safe glycemic range, gray area the exercise period, and blue and black triangles the bolus insulin and meals, respectively. Blue and red regions show the space between the 25% and 75% quartiles of the BG at every sample for EnMPC and rMPC, respectively.

