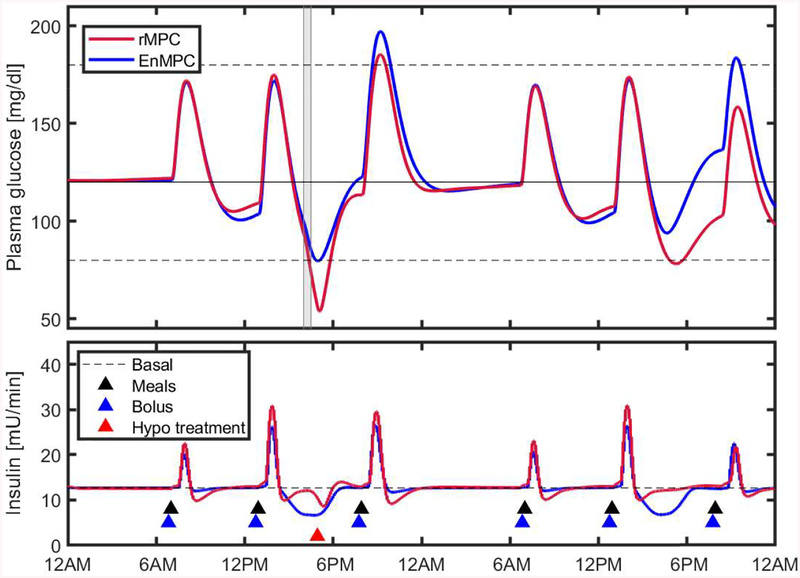
Figure 7:
Blood Glucose control performance of rMPC (baseline) and EnMPC for a representative subject (patient # 5). Solid black line represents the set point (120 mg/dL), dotted black lines the safe glycemic range (80 – 180 mg/dL), gray area the exercise period, and blue and black triangles the bolus insulin and meals, respectively, sample. Hypo treatment is needed for the subject under rMPC.

