Fig. 2.
In vivo comparison of IgG-[L]-scFv to common BsAb designs
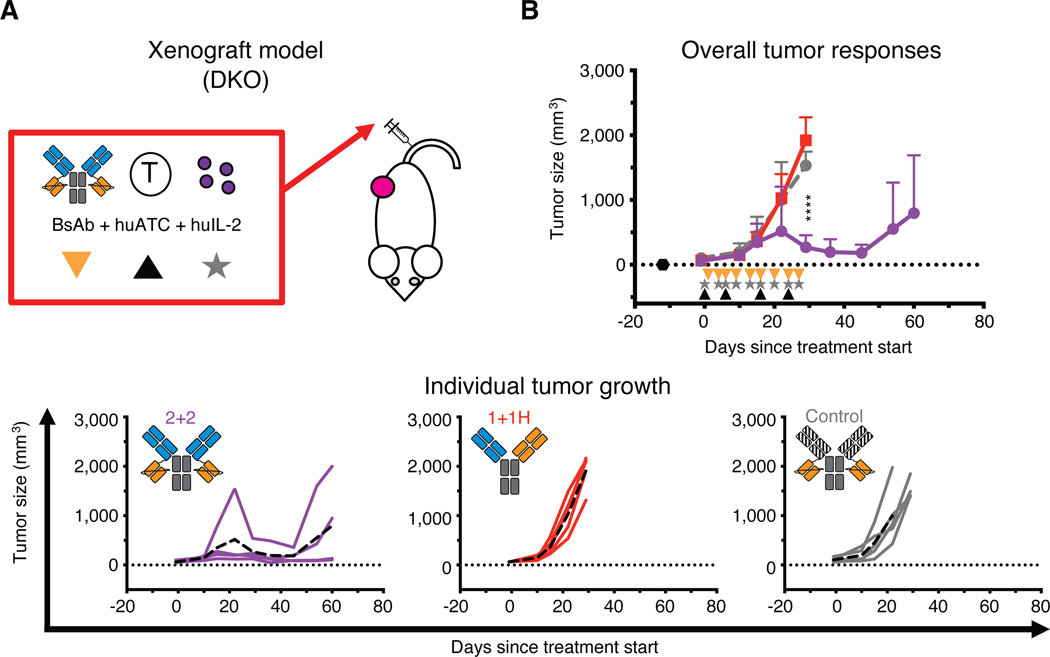
(A) Schematic of the treatment design for the xenograft tumor model. 25 pmol of BsAb was administered intravenously twice per week (black triangle), 40 million activated human T cells (huATC) were administered intravenously once per week (orange triangle), and human IL-2 (1,000 U) was administered subcutaneously twice per week (gray star). An anti-GPA33 BsAb was used as a control. (B) Average (top) and individual mouse (bottom) tumor responses in each group. In the overall response graph, each line represents one treatment group (n=4–5). The dotted black line represents no measurable tumor, and the black hexagon represents the tumor implantation. Tumor averages were calculated until at least one mouse had to be euthanized. Data are shown as means ± standard deviation. In the individual response graphs, each line represents a single mouse, and the dashed line represents the group average. For reference: 2+2 is purple, 1+1H is red, and the control BsAb is gray. Statistical significances were calculated by two-way analysis of variance (ANOVA) with Tukey correction. ****P < 0.0001 for control or 1+1H compared to 2+2.

