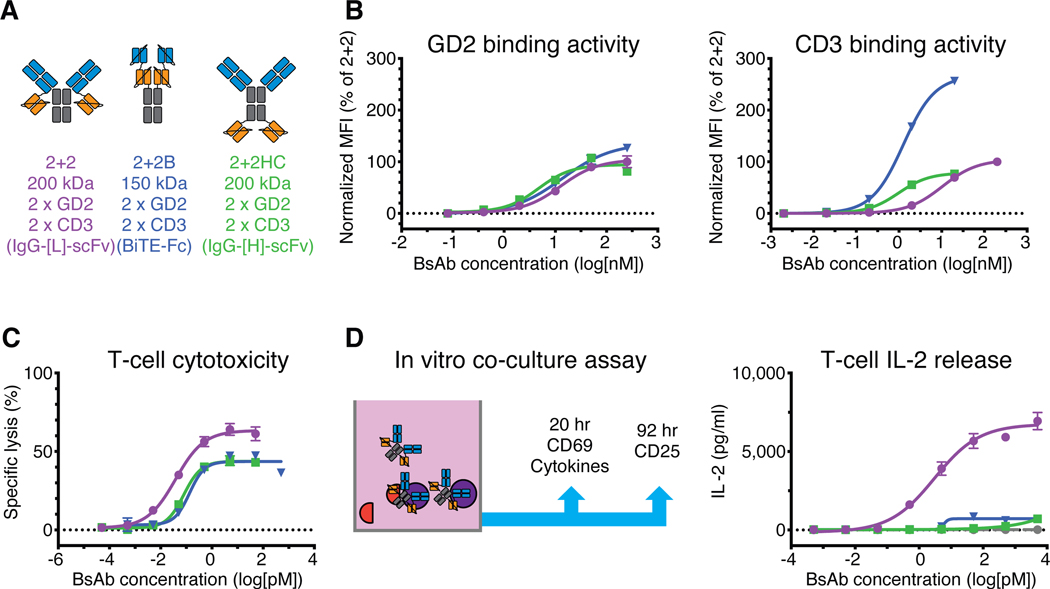
Fig. 3.
Comparison of dual bivalent BsAb designs
(A) Schematic of dual bivalent BsAb panel: IgG-[L]-scFv (2+2), BiTE-Fc (2+2B), and IgG-[H]-scFv (2+2HC). Orange represents anti-huCD3ε domains (derived from huOKT3) and blue represents anti-GD2 domains (derived from hu3F8). (B) Representative cell-binding activity of each BsAb against GD2(+) human M14 melanoma cells (left) and CD3(+) activated human T cells (right), measured by flow cytometry. Geometric mean intensity was normalized to 2+2 (100%) for each BsAb. (C) Representative T cell-dependent cytotoxicity for each BsAb. (D) Schematic of in vitro co-culture assay (left) and graph of results (right). For reference: 2+2 is purple, 2+2B is blue, and 2+2HC is green. Each curve represents one BsAb, and each point represents a single concentration, with two (FACS, cytokine) or three (cytotoxicity) technical replicates. Data are shown as means ± standard deviation.

