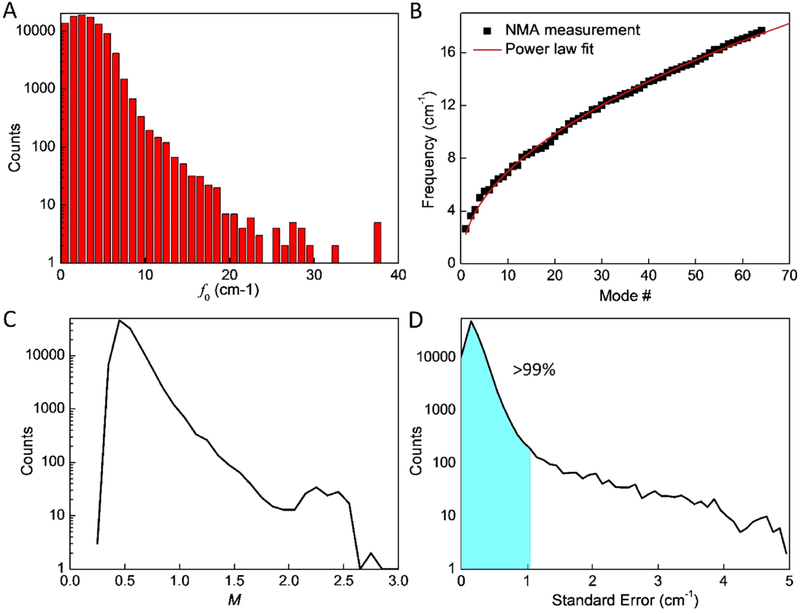
Figure 3.
Statistical and analysis results of the database of the natural frequency of protein structures. A) The histogram of the distribution of the base frequency f0. B) The natural frequencies of the vibration mode 1 to 64 of the protein structure 101m and the result as fitted to the power law as given by Eq. (1) as fi= 2.26i0.491. C) The histogram of the distribution of the power factor M. D) The histogram of the distribution of the standard error between the NMA measurements and the results fitted by the power law, it is noticed that >99% of the results has σSE<1 cm−1.

