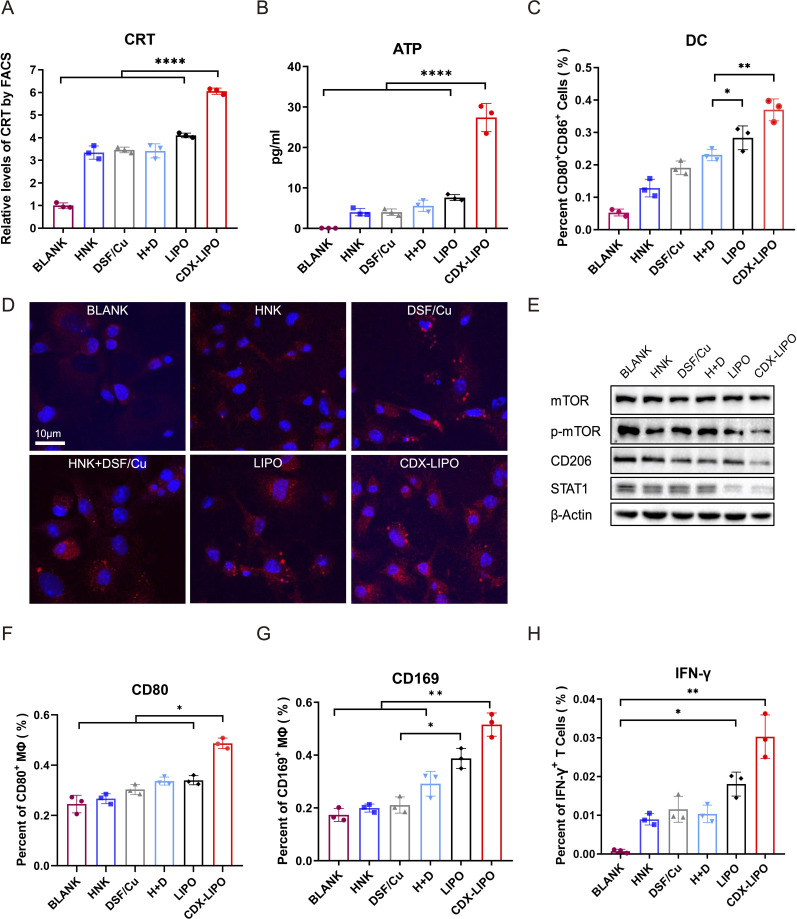
Figure 4.
In vitro ICD induced by treatments and the effect on the antigen-presenting cells. (A) Flow cytometric quantification of calreticulin (CRT). (B) Extracellular adenosine triphosphate (ATP) level. (C) Flow cytometric analysis of dendritic cell (DC) maturation. (D) Fluorescent images of the exposed CRT on the C6 cell surface after treatments (scale bar: 10 µm). (E) M2 repolarization after treatments. (F and G) Activation of macrophages, as reflected by the biomarkers of CD80 and CD169. (H) Proportion of IFN-γ+ T cells primed with the matured DC cells that were activated by the drug-treated tumor cells. ATP, adenosine triphosphate; CDX-LIPO, CDX-modified liposomes; CRT, calreticulin; DC, dendritic cell; DSF/Cu, disulfiram/copper ion; HNK, honokiol; ICD, immunogeniccell death; IFN-γ, interferon gamma; LIPO, non-modified liposomes; mTOR, mammalian target of rapamycin.

