Fig. 8.
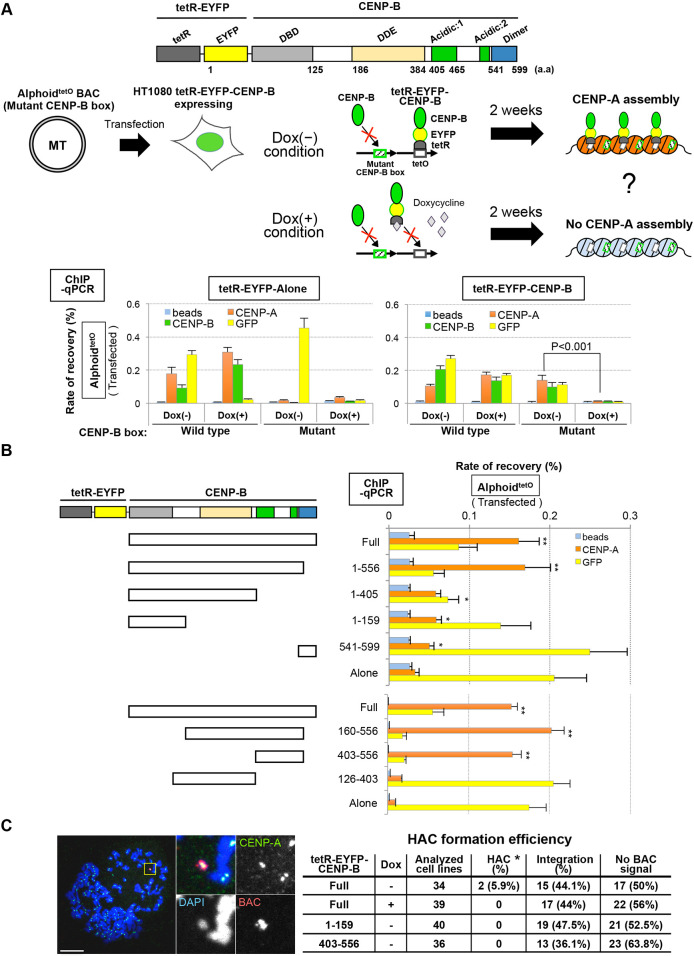
Identification of a de novo CENP-A assembly domain on CENP-B. (A) Functional verification of tetR–EYFP–CENP-B fusions. Top: schematic of tetR–EYFP–CENP-B construction. Middle: schematic of the experimental design and expected effect of tetR–EYFP–CENP-B. Bottom: effect on CENP-A assembly by tethering of tetR–EYFP–CENP-B or tetR–EYFP alone (negative control). The cells were cultured in the presence (+) or absence (−) of doxycycline (Dox) during 2 weeks (2W) post-transfection. Enrichment of tetR-fusion proteins, CENP-A and CENP-B on transfected alphoidtetO DNAs was detected by ChIP-qPCR analysis using the indicated antibodies: blue, without antibody for negative control; orange, anti-CENP-A; green, anti-CENP-B; yellow, anti-GFP antibody for EYFP. Results are mean±s.e.m. (n=3 experiments). P-values are indicated in the figure (two-tailed t-test). (B) Identification of CENP-B domains enhancing de novo CENP-A assembly. Left: schematic of the tetR-fusion CENP-B domain series. Right: the CENP-A assembly activity of each CENP-B domain was detected using ChIP-qPCR in the absence of Dox. Results are mean±s.e.m. (n=3 experiments). *P<0.05; **P<0.005 (two-tailed t-test). (C) HAC formation by tethering of CENP-B domain series fusions to mutant CENP-B box alphoidtetO BAC DNA in an HT1080 cell line expressing tetR–EYFP–CENP-B. Left: mitotic chromosomes from one of the HAC cell lines obtained (HT1080 N21-1, see below) were stained with DAPI (blue), anti-CENP-A antibody (green), and BAC FISH probe (red). Scale bar: 10 µm. Right: table showing HAC formation efficiency. Naked mutant CENP-B box alphoidtetO BAC DNAs were transfected into HT1080 cell lines stably expressing tetR–EYFP fusion proteins indicated in the table (see Materials and Methods) in the presence or absence of doxycycline. The ‘analyzed cell lines’ column shows the number of colonies of cells isolated under selection using G418. The fate of the introduced BAC DNA was analyzed by FISH using a BAC probe. BAC DNA was detected either as an entity independent from the host chromosome (HAC) or as part of the host chromosome (integration). Two HAC cell lines were obtained. In these two cell lines, HAC signals were detected as a single HAC per cell in 92.3% and 90% of cells (n>20 cells). No integration signal was observed on the host chromosomes in these two HAC cell lines.

