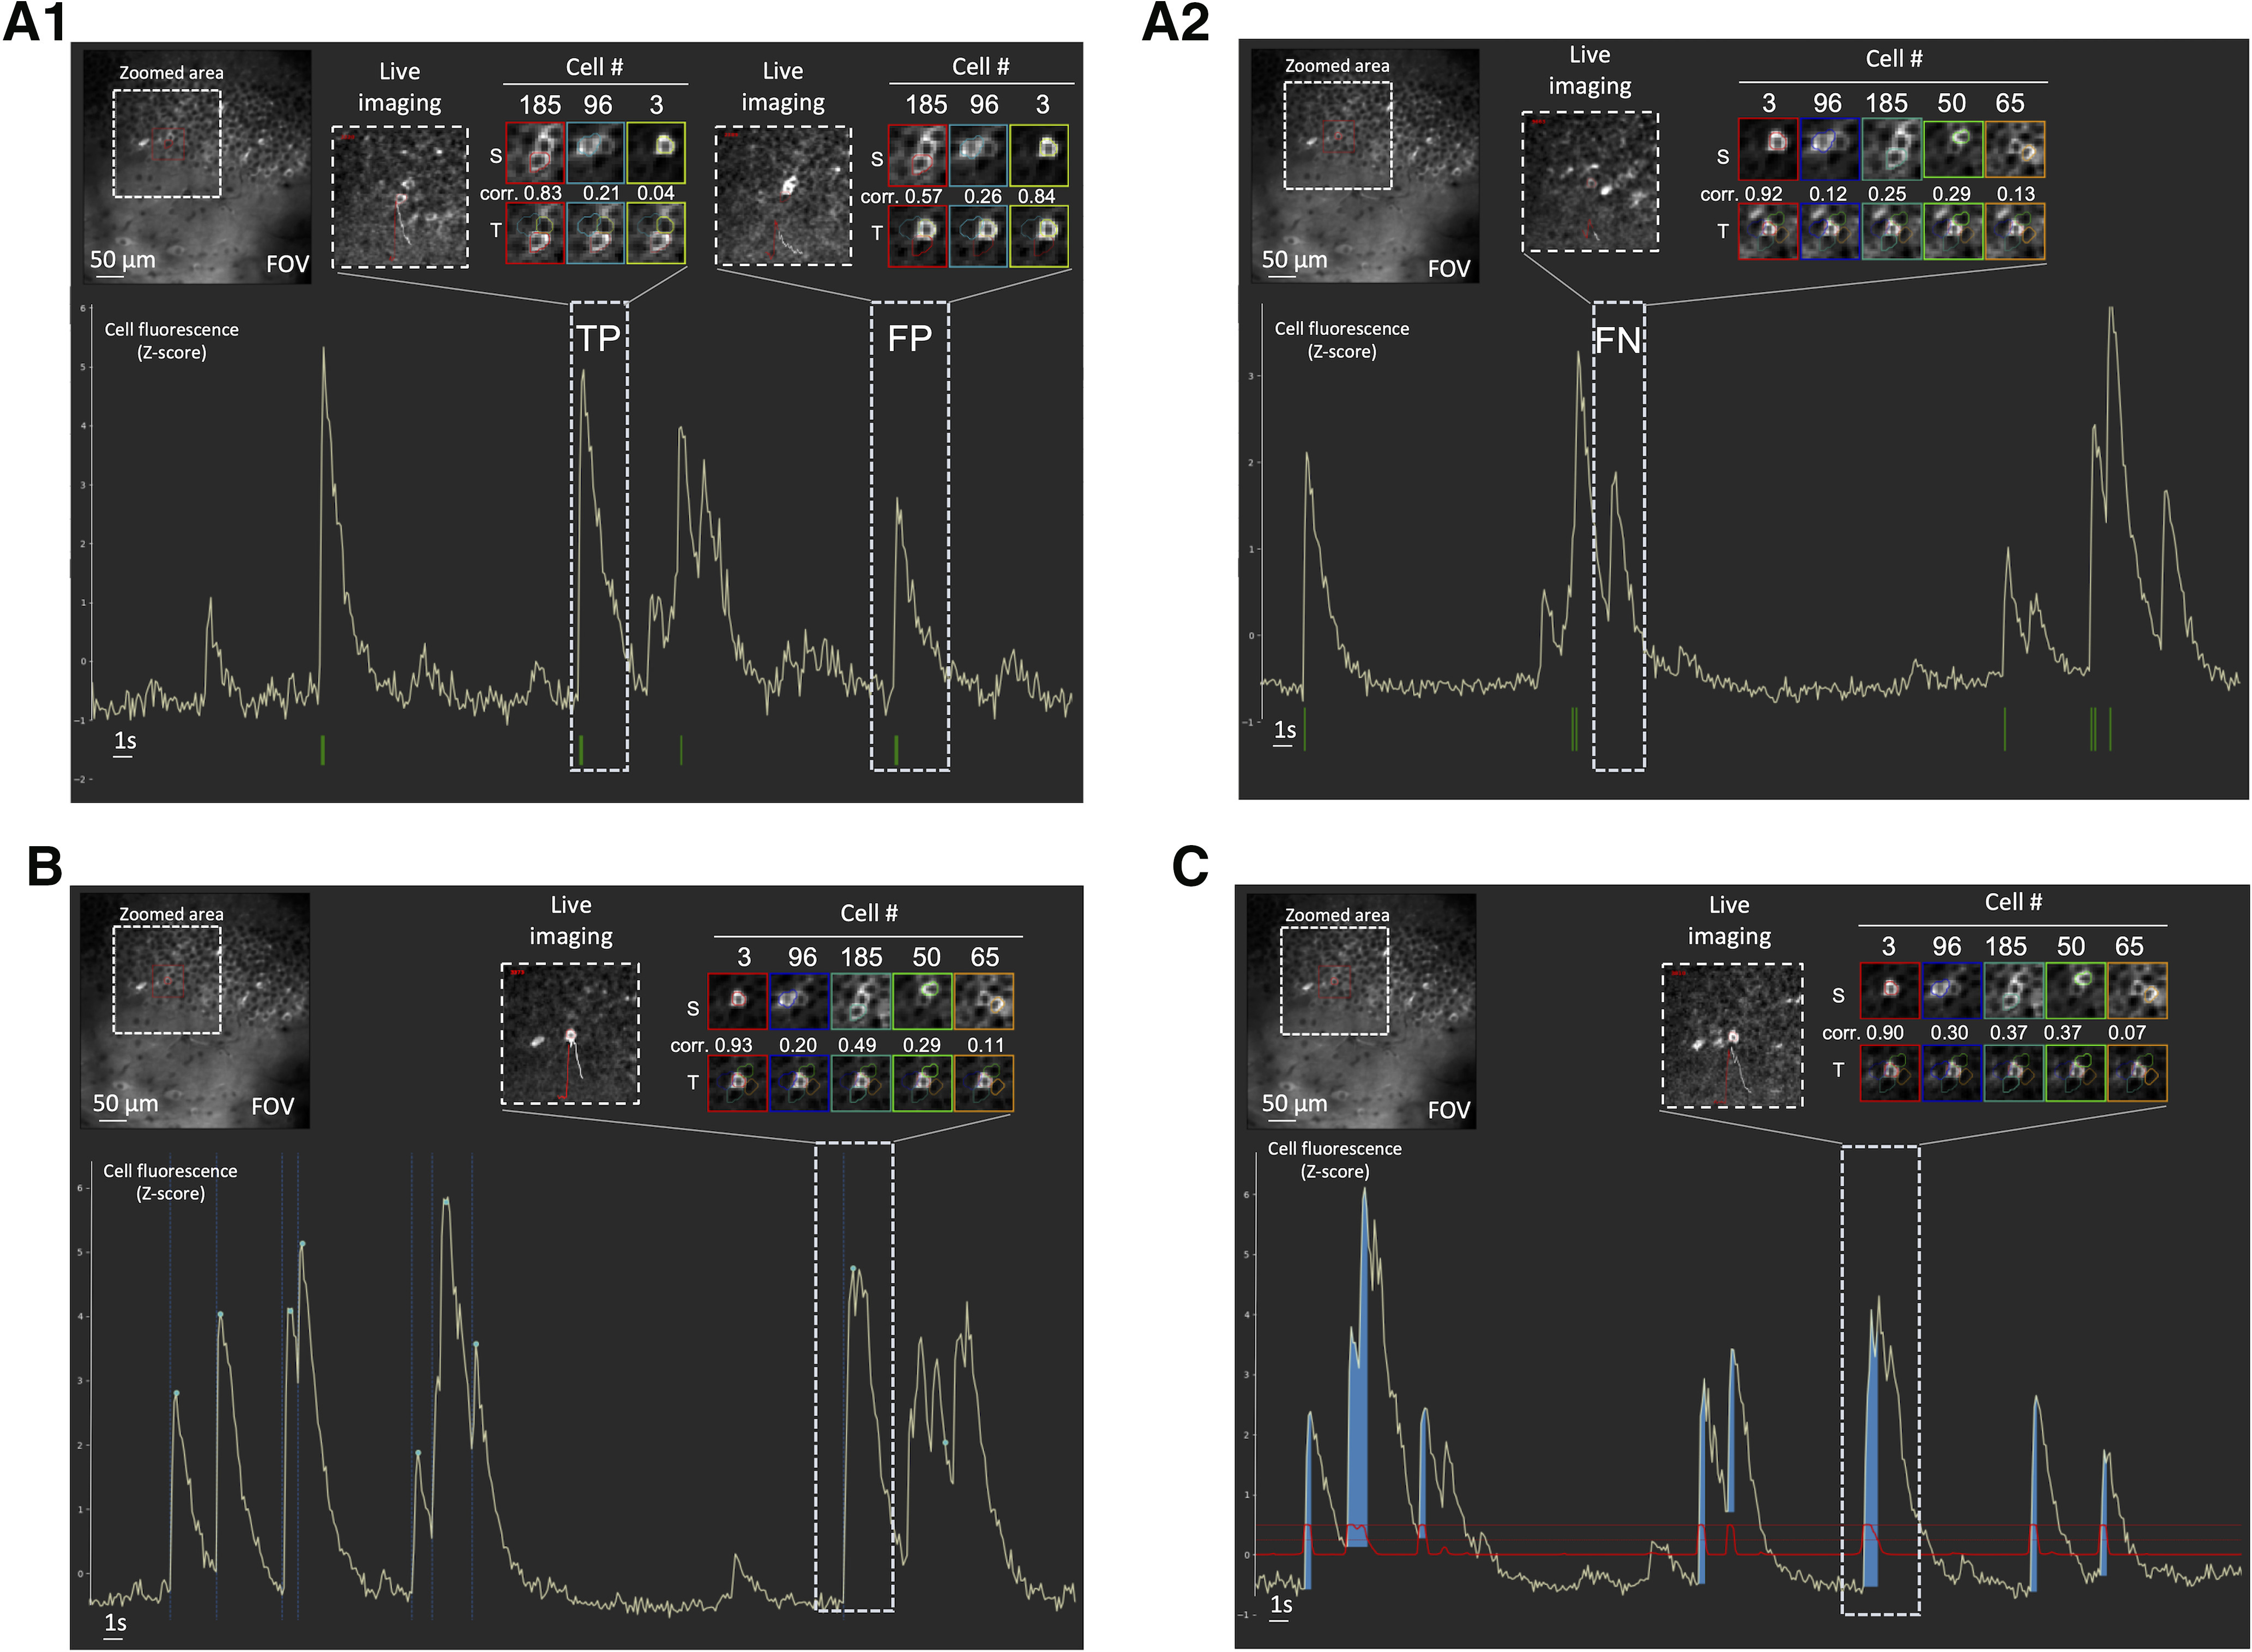
Figure 2.

Examples of different uses of the GUI. The GUI can be used for data exploration (A1, A2), to establish the ground truth (B) and to evaluate DeepCINAC predictions (C). A, The GUI can be used to explore the activity inference from any methods. The spikes inferred from CaImAn are represented by the green marks at the bottom. The GUI allows the user to play the movie at the time of the selected transient and visualize the transients and source profile of the cell of interest. A1, Movie visualization and correlation between transient and source profiles allow the classification of the first selected transient as true positive (TP) and the second selected transient as false positive (FP). A2, Movie visualization and correlation between transient and source profiles allow the classification of the selected transient as false negative (FN). B, The GUI can be used to establish a ground truth. In this condition, it offers the user the possibility to manually annotate onset and peak of calcium transient. Onsets are represented by vertical dashed blue lines, peaks by green dots. C, When the activity inference is done using DeepCINAC, the GUI allows the display of the classifier predictions. The prediction is represented by the red line. The dashed horizontal red line is a probability of one. The blue area represents time periods during which the probability is above a given threshold, in this example 0.5. T: transient profile, S: source profile, Corr: correlation, FOV: field of view.
