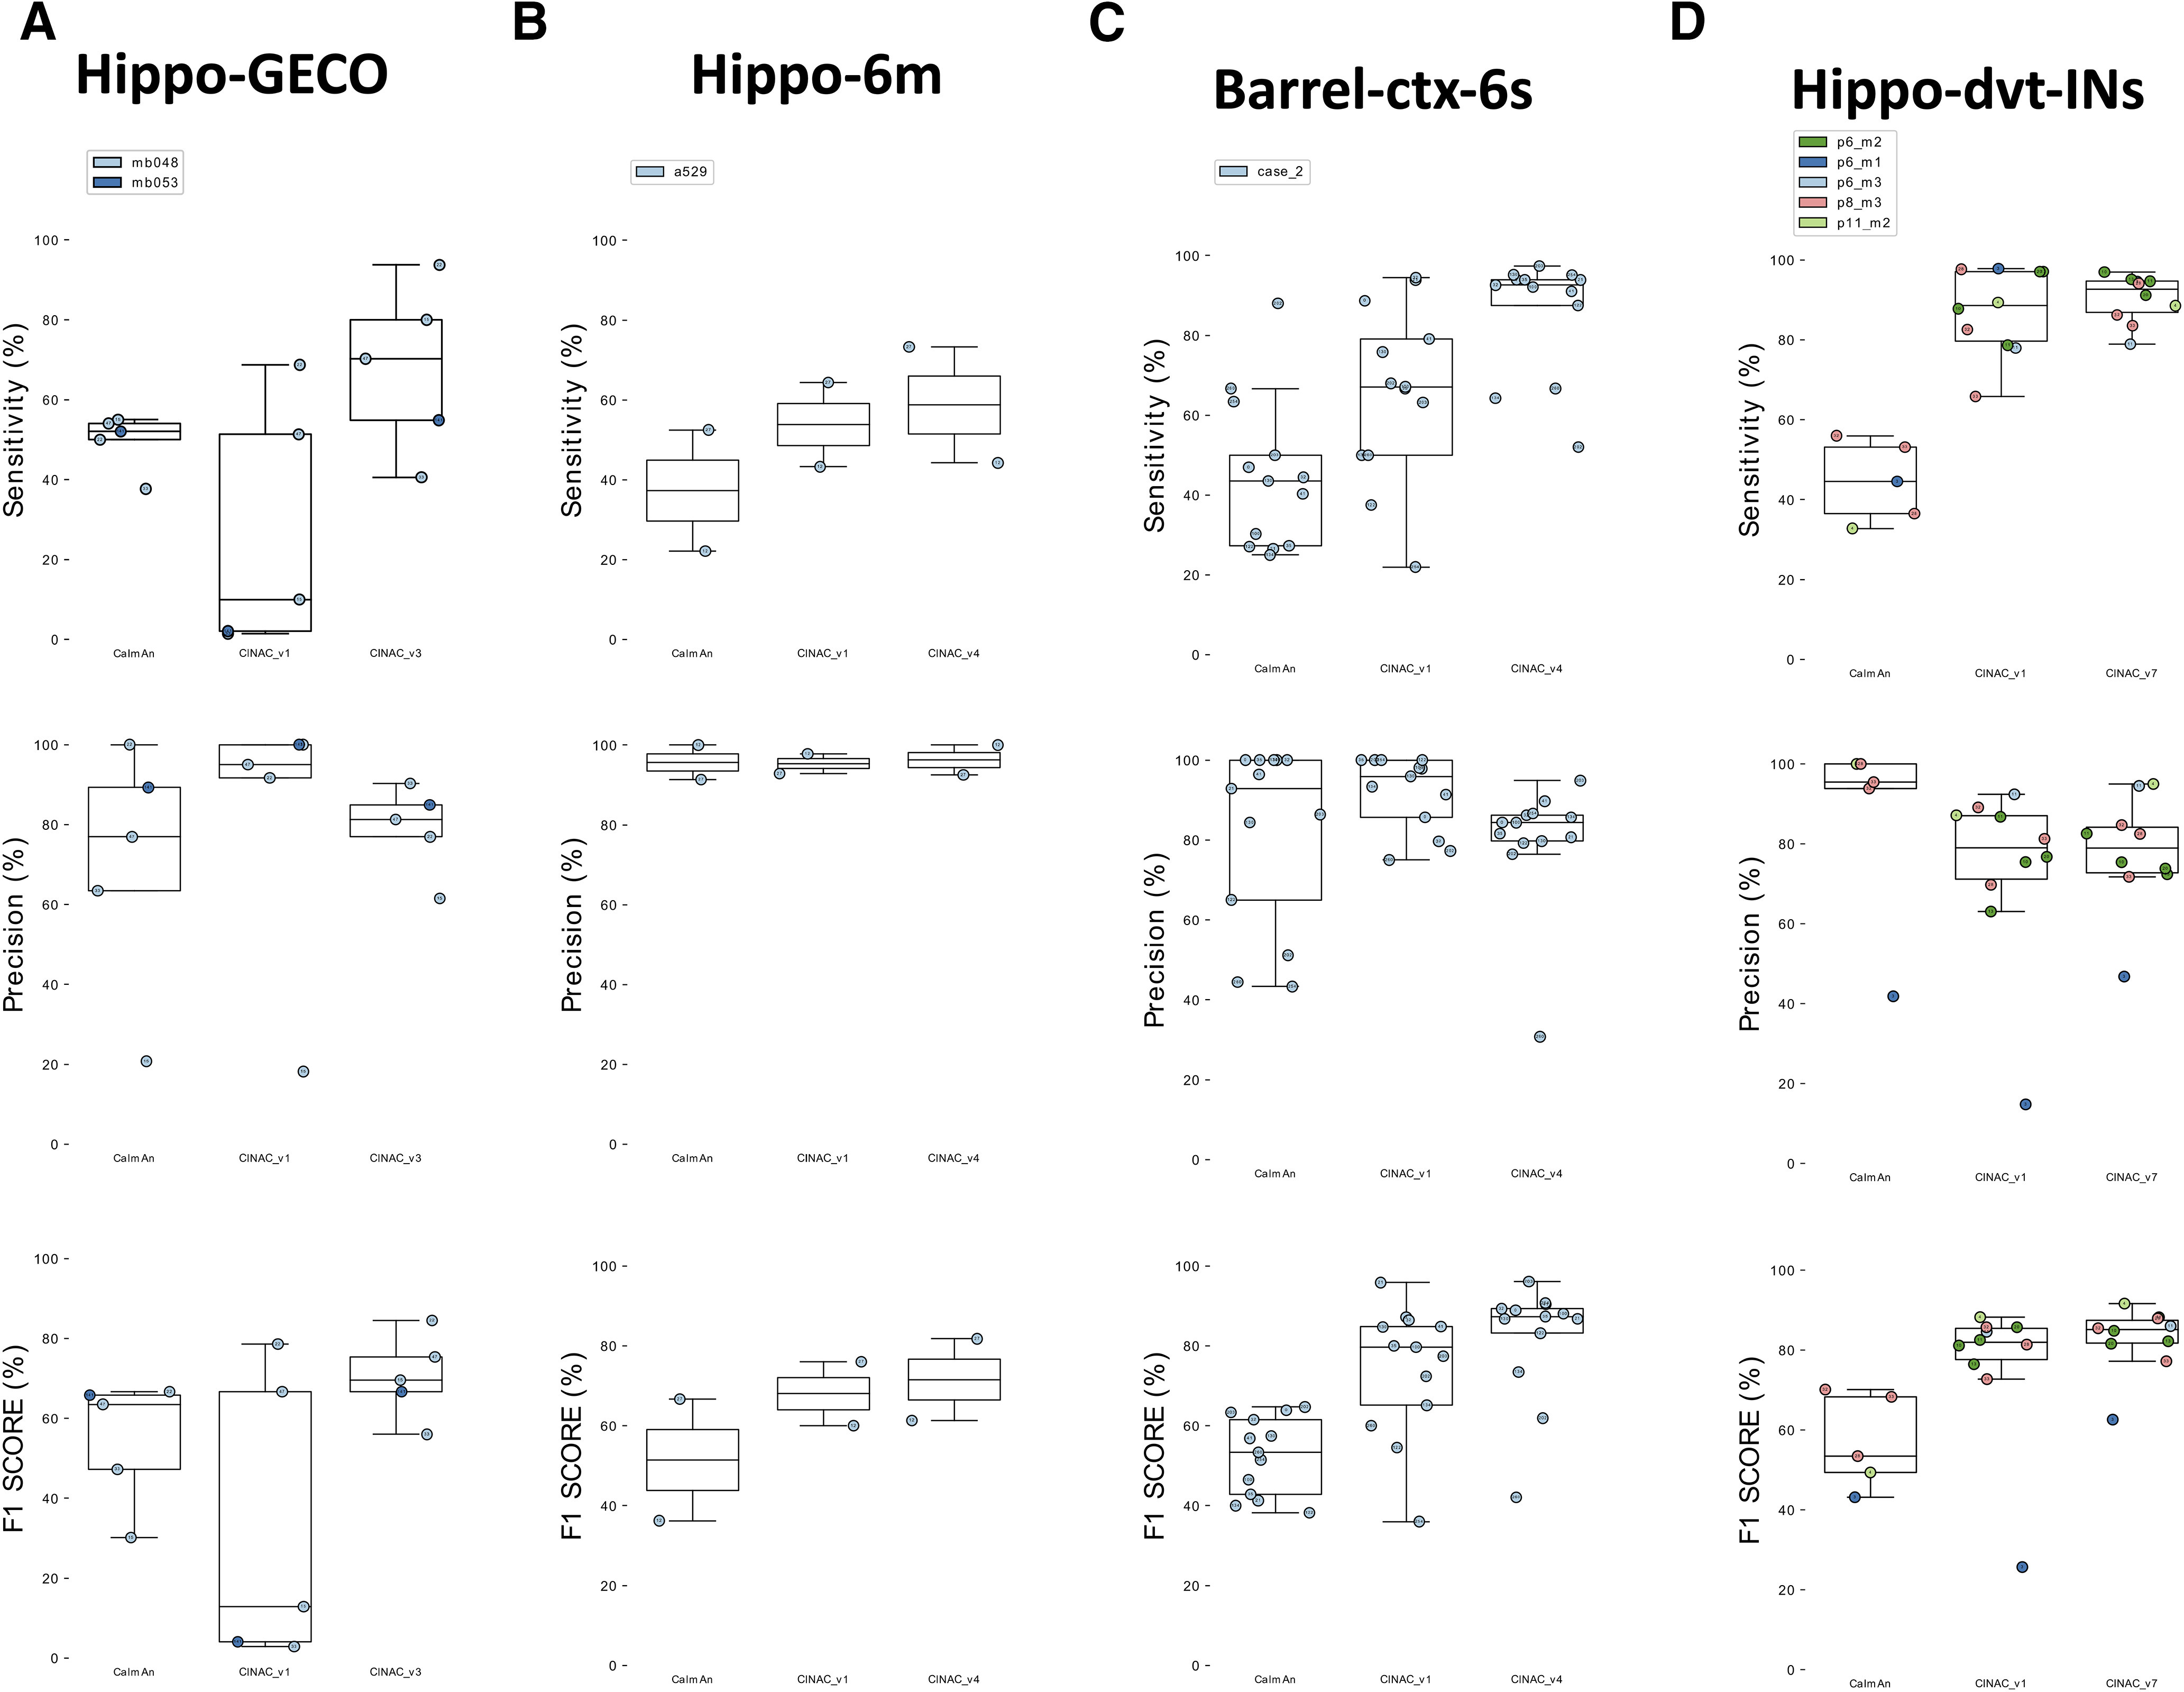
Figure 8.

Use of DeepCINAC classifiers to optimize performances on various dataset. A, Boxplot displaying the sensitivity (top panel), precision (middle panel) and F1 score (bottom panel) for Hippo-GECO dataset. For each panel, we evaluated CaImAn performance as well as two different versions of CINAC (v1 and v3). CINAC_v1 is a classifier trained on data from the Hippo-dvt dataset and CINAC_v3 is a classifier trained on data from the Hippo-GECO dataset (Table 1; Extended Data Table 1-1). B, Boxplot displaying the sensitivity (top panel), precision (middle panel) and F1 score (bottom panel) for Hippo-6m dataset. For each panel, we evaluated CaImAn performance as well as two different versions of CINAC (v1 and v4). CINAC_v1 is a classifier trained on data from the Hippo-dvt dataset and CINAC_v4 is a classifier trained on data from the Hippo-dvt, Hippo-6m, and Barrel-ctx-6s dataset (Table 1; Extended Data Table 1-1). C, Boxplot displaying the sensitivity (top panel), precision (middle panel) and F1 score (bottom panel) for Barrel-ctx-6s dataset. For each panel, we evaluated CaImAn performance as well as two different versions of CINAC (v1 and v4). CINAC_v1 is a classifier trained on data from the Hippo-dvt dataset and CINAC_v4 is a classifier trained on data from the Hippo-dvt, Hippo-6m, and Barrel-ctx-6s dataset (Table 1; Extended Data Table 1-1). D, Boxplot displaying the sensitivity (top panel), precision (middle panel) and F1 score (bottom panel) for Hippo-dvt-INs dataset. For each panel, we evaluated CaImAn performance as well as two different versions of CINAC (v1 and v7). CINAC_v1 is a classifier trained on data from the Hippo-dvt dataset and CINAC_v7 is a classifier trained on interneurons from the Hippo-dvt dataset (Table 1; Extended Data Table 1-1). Each colored dot represents a cell, the number inside indicates the cell’s id and each color represents a session as identified in the legend. Figure 8 is supported by Extended Data Figures 8-1, 8-2, 8-3.
