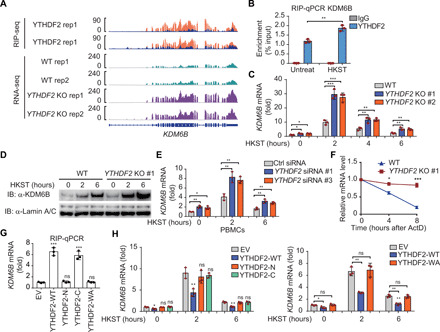
Fig. 4. YTHDF2 degrades KDM6B mRNA via an m6A-dependent manner.

(A) IGV tracks displaying YTHDF2 RIP-seq (top) and RNA-seq (bottom) read distribution in KDM6B mRNA of WT and YTHDF2 KO THP-1 cells with HKST infection. (B) RIP-qPCR detecting the binding of YTHDF2 to the transcripts of KDM6B in THP-1 cells stimulated with and without HKST. (C) The expression of KDM6B analyzed by RT-PCR increased in YTHDF2 KO versus WT THP-1 cells after infection with HKST for indicated periods. (D) Immunoblot analysis of KDM6B in WT and YTHDF2 KO THP-1 cells exposed to HKST for indicated periods. (E) PBMCs were transfected with YTHDF2 or control siRNA for 48 hours and then treated with HKST, and KDM6B transcription was analyzed by real-time PCR. (F) Representative mRNA profile of KDM6B at indicated time points after actinomycin D (5 μg/ml) treatment in WT and YTHDF2 KO THP-1 infected with HKST. (G) RIP-qPCR detecting the binding region of YTHDF2 to the mRNA of KDM6B in THP-1 cell lines that overexpressed Flag-tagged YTHDF2 (WT) as well as YTHDF2 truncations (N and C termini) or site mutation (WA) exposed to HKST. (H) THP-1EV, THP-1YTHDF2-WT, THP-1YTHDF2-N, THP-1YTHDF2-C (left), and THP-1YTHDF2-WA (right) cells were stimulated with HKST for indicated periods, and then KDM6B expression was analyzed by real-time PCR. Data in (D) are representative of three individual experiments with similar results. Data in (B), (C), and (E) to (H) are presented as means ± SEM combined from three independent experiments with triplicate, *P < 0.05, **P < 0.01, and ***P < 0.001 compared with control cells.
