
Fig. 1. Cryo-EM structure of the ESCRT-III Vps24 filament.
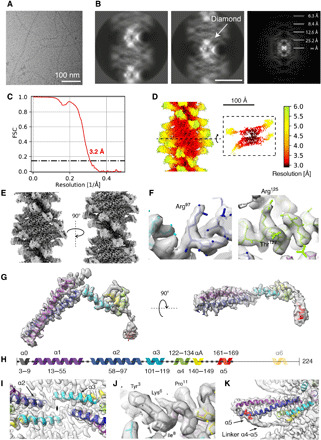
(A) Representative micrograph of ice-embedded Vps24 filaments. (B) Two 2D class averages of Vps24 and power spectrum derived from 2D class averages. (C) FSC curve indicating a resolution of 3.2 Å according to the 0.143 cutoff. (D) Local resolution mapped onto surface of cryo-EM map showing variation from 2.9 to 6.0 Å. (E) Two side views of Vps24 filament cryo-EM map related by a 180° rotation around the filament axis. (F) Typical side-chain density detail in the filament core. (G) Carved cryo-EM density of an extended Vps24 molecule. (H) Primary structure of Vps24 with color-coded seven helices used in the figures throughout the manuscript. (I) Connecting loop density between helix α2 and helix α3 viewed along the twofold symmetry axis (d axis). (J) Cryo-EM density of N-terminal helix α0 in the filament core. (K) Density of linker stretch connecting helix α4 and α5 at the outside of the filament.