
Fig. 2. Distinctive features of Harpegnathos neurons and glia.
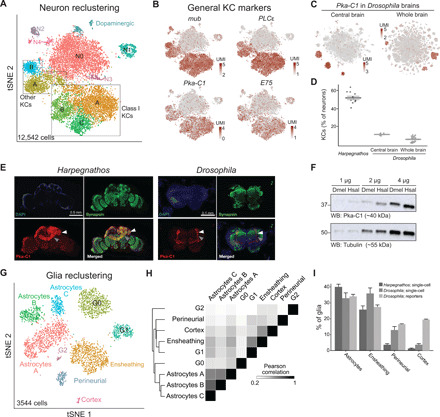
(A) Annotated tSNE visualization for the reclustering of neurons from six worker and five gamergate replicates at day 30. (B) Heatmap plotted over neuronal tSNE showing normalized UMIs for known mushroom body markers from Drosophila (left) and A. mellifera (right). (C) Heatmap plotted over neuronal tSNE for the KC marker Pka-C1 from two Drosophila single-cell RNA-seq datasets, one from the central brain after removing optic lobes [left; (15)] and one from the whole brain, inclusive of the optic lobes [right; (14)]. (D) Relative abundance of KCs as determined by percentage of neurons in clusters that express Pka-C1 in Harpegnathos brains and in the two Drosophila single-cell RNA-seq datasets. Horizontal bars indicate means ± SEM. (E) Immunofluorescence for the neuronal marker synapsin and the KC marker Pka-C1 in Harpegnathos (left) and Drosophila (right) with 4′,6-diamidino-2-phenylindole (DAPI) as nuclear counterstain. Gray arrowhead, pedunculus; white arrowhead, calyx. (F) Western blot (WB) for Pka-C1 in the indicated amount of total protein extract from Drosophila (Dmel) or Harpegnathos (Hsal) brains. Tubulin was used as loading control. (G) Annotated tSNE visualization for the reclustering of glia from six worker and five gamergate replicates at day 30. (H) Clustered heatmap showing the pairwise Pearson correlation score between collapsed transcriptomes (pseudobulk analysis) of glia clusters, considering only variable genes that were used to define the clusters by Seurat. (I) Relative abundance of key glia subsets in Harpegnathos single-cell RNA-seq, Drosophila single-cell RNA-seq from the whole brain (14), and as defined by glial subset-specific expression of GAL4 (20). Bars indicate means + SEM.