
Fig. 1. Experimental task and behavioral results.
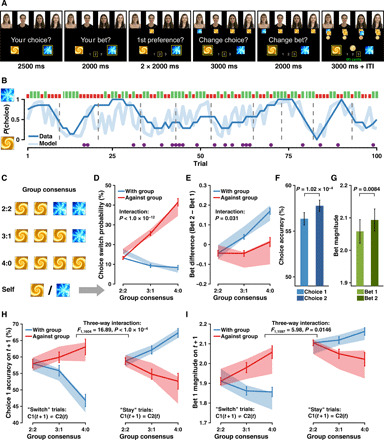
(A) Task design. Participants (N = 185) made an initial choice and bet (Choice 1 and Bet 1), and after observing the other four coplayers’ initial choices, they were asked to make adjustments (Choice 2 and Bet 2), followed by the outcome. (B) Task dynamic. Trial-by-trial behavior for an example participant. Blue curves, seven-trial running averages (dark) and predicted choice probabilities from the winning model M6b (light). Green (long) and red (short) bars, rewarded and unrewarded trials; purple circles, switches on Choice 2; dashed vertical lines, reversals every 8 to 12 trials. (C) Illustration of group consensus (view from each participant). (D) Social influence on within-trial choice adjustments. Choice switch probability as a function of group consensus [as (C)] and relative direction (with versus against) of the group. Solid lines indicate actual data [means ± within-subject SE (SEM)]. Shaded error bars represent 95% highest density interval (HDI) of mean effects predicted by M6b (i.e., posterior predictive checks). (E) Social influence on within-trial bet adjustments. Bet difference as a function of group consensus and direction of the group. Format is as in (D). (F and G) Enhanced Choice 2 and Bet 2 performance after adjustment. (H) Social influence on between-trial choice accuracy. Choice 1 accuracy on the current trial as a function of choice adjustment on the previous trial (Choice 2 type: SwSt), direction of the group, and group consensus. Format is as in (D). (I) Social influence on between-trial bet magnitude. Bet 1 magnitude on the current trial as a function of choice adjustment on the previous trial, relative direction of the group, and group consensus. Format is as in (D).