
Fig. 3. Neural substrates of dissociable value signals and RPE.
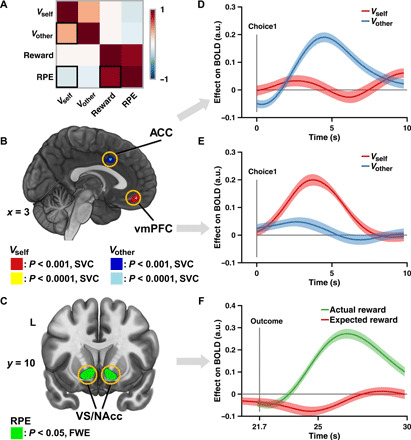
(A) Correlation matrix of value-related decision variables derived from M6b. (B) Neural representation of value signals. Vself and Vother were encoded in the vmPFC (red/yellow) and the ACC (blue/light blue), respectively. Sagittal slice at x = 3. Display thresholded at P < 0.001 and P < 0.0001, small volume–corrected (SVC); actual results were threshold-free cluster enhancement (TFCE) SVC at P < 0.05. (C) Neural representation of RPE. RPE was encoded in the VS/NAcc. Coronal slice at y = 10. Display thresholded at P < 0.05, family-wise error (FWE) corrected; actual results were TFCE whole-brain FWE corrected at P < 0.05. (D and E) Region of interest (ROI) time series analyses of vmPFC and ACC, demonstrating a double dissociation of the neural signatures of value signals. (D) Blood oxygen level–dependent (BOLD) signal of ACC was only positively correlated with Vother (β = 0.1560, P < 1.0 × 10⁻⁵, permutation test; blue line), but not with Vself (β = 0.0011, P = 0.9478, permutation test; red line), whereas (E) BOLD signal of vmPFC was only positively correlated with Vself (β = 0.1458, P < 1.0 × 10⁻⁵, permutation test; red line) but not with Vother (β = 0.0128, P = 0.4394, permutation test; blue line). Lines and shaded areas show means ± SEM of β weights across participants. (F) ROI time series analyses of VS/NAcc, showing its sensitivity to both components of RPE (i.e., actual reward R and expected reward Vself). BOLD signal of VS/NAcc was positively correlated with actual reward (β = 0.2298, P < 1.0 × 10⁻⁵, permutation test; green line) and negatively correlated with expected reward (β = −0.0327, P = 0.021, permutation test; red line). Format is as in (D). a.u., arbitrary units.