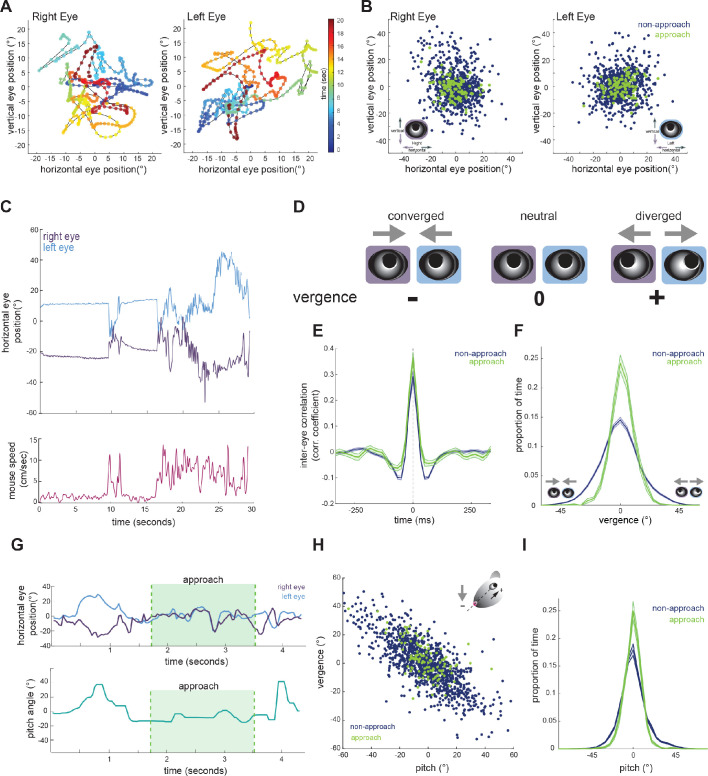
Figure 2. Eye position is more aligned across the two eyes during approach periods.
(A) Example eye movement trajectory for right and left eyes for a 20 s segment, with points color-coded for time. (B) Horizontal and vertical position for right and left eyes during approach and non-approach times. N = 7 animals, 105 trials, 792 time pts (non-approach), 110 time pts (approach), representing a random sample of 0.22% of non-approach and 0.52% of approach time points. (C) Example trace of horizontal eye positions (top) and running speed (bottom) for a 30 s segment. (D) Schematic demonstrating vergence eye movements. (E) Cross correlation of horizontal eye position across the two eyes for non-approach and approach periods. (F) Histogram of vergence during non-approach and approach. (G) Example trace of horizontal eye position (top) and head pitch (bottom) before, during, and after an approach. (H) Scatter plot of head pitch and eye vergence. As head pitch tilts downwards, the eyes move temporally to compensate (as in schematic). N = 7 animals, 105 trials, 1240 time points (non-approach), 132 time points (approach), representing a sample of 0.35% of non-approach and 0.63% of approach time points. (I) Histogram of head pitch during approach and non-approach periods, across all experiments.

