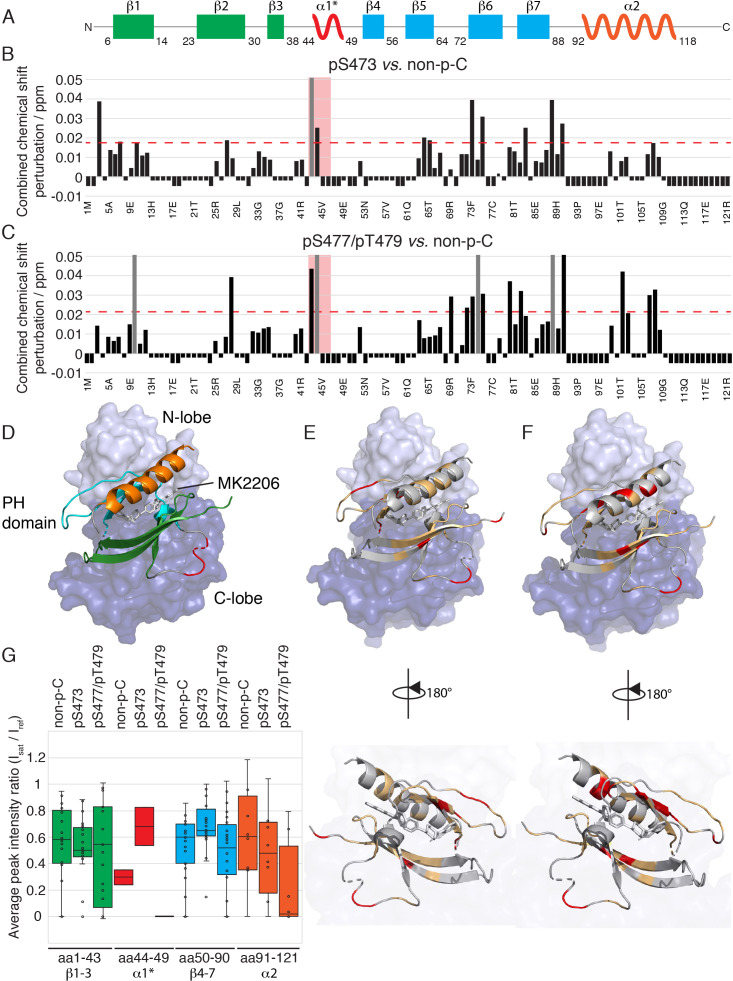
Figure 5. The PH domain of Akt interacts with the kinase domain differently depending on C-tail phosphorylations.
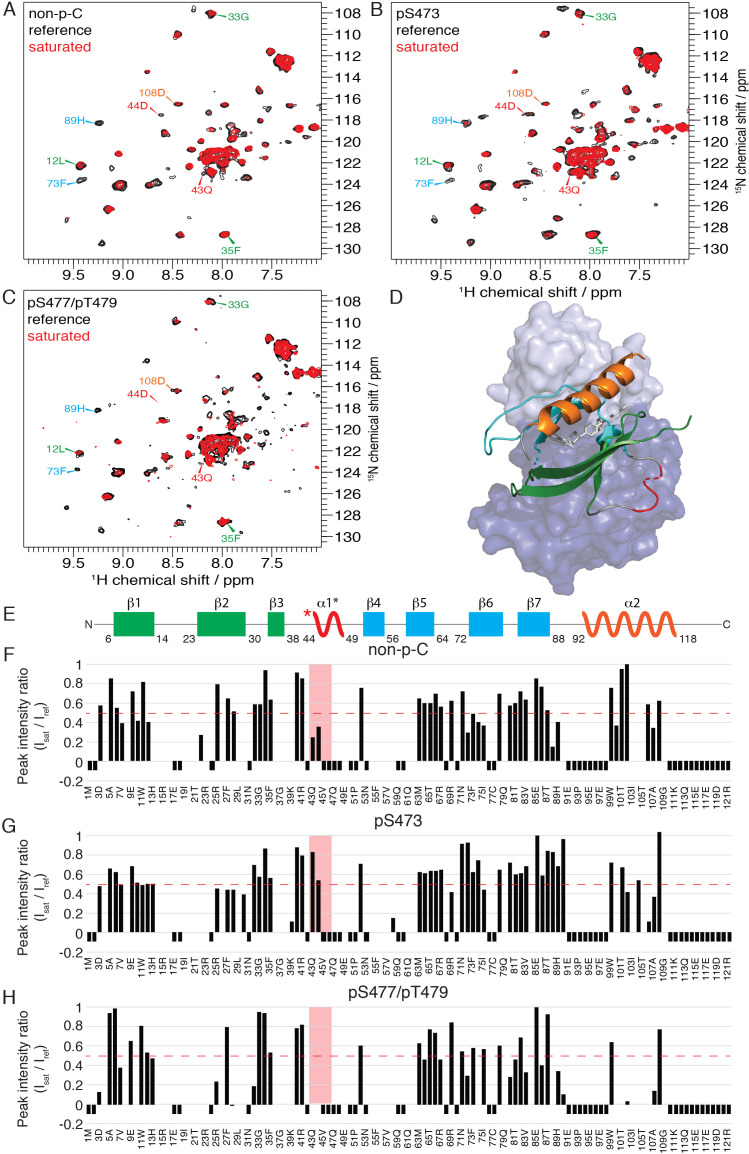
(A) Cartoon representation of secondary structure elements (rectangle for β-strands, zigzag for α-helices) in Akt PH domain. Color coding represents regions with distinct binding modes to the kinase domain. Star indicates that the α-helix is present only when Akt is bound to IP4. (B–C) Combined chemical shift perturbations derived from spectra in Figure 4 and plotted along the PH domain primary sequence for pSer473 (B) and pSer477/pThr479 (C) referenced to non-p-C. Dashed red line corresponds to the standard deviation to the mean, excluding outliers (higher than 3xStDev). Grey bars indicate peaks that disappeared from the spectrum, also indicating strong interaction. Red area highlights the short hinge primarily studied here. Negative bars (−0.05) indicate non-assigned residues, negative bars (−0.025) indicate residues which assignment could not be easily transferred or recovered in the context of full-length Akt. (D) Structure of allosteric drug inhibited Akt (PDB: 3O96, [Wu et al., 2010]) with PH domain as ribbon in the front and kinase domain as surface in the back (N-lobe in light blue, C-lobe in dark blue). Color coding of secondary structure elements in the PH domain corresponds to (A). Allosteric inhibitor MK2206 is displayed in white. Main Akt domains are labeled. (E–F) Same structure representation as in (D) with the most significantly affected residues (chemical shift perturbations higher than the standard deviation) colored in red in the PH domain in case of pSer473 (E) and pSer477/pThr479 (F). Non-affected residues are shown in light orange and non-assigned residues in grey. Representations rotated by 180° are shown. (G) Statistical bar and whisker plots of saturation transfer efficiencies from CST data (Figure 5—figure supplement 3) for each C-tail phospho-state, categorized and color coded according to secondary structure elements as in (A) and (D). A ratio of 0 indicates maximum saturation transfer efficiency (very tight interaction) whereas a ratio of 1 indicate no saturation transfer (no interaction).


