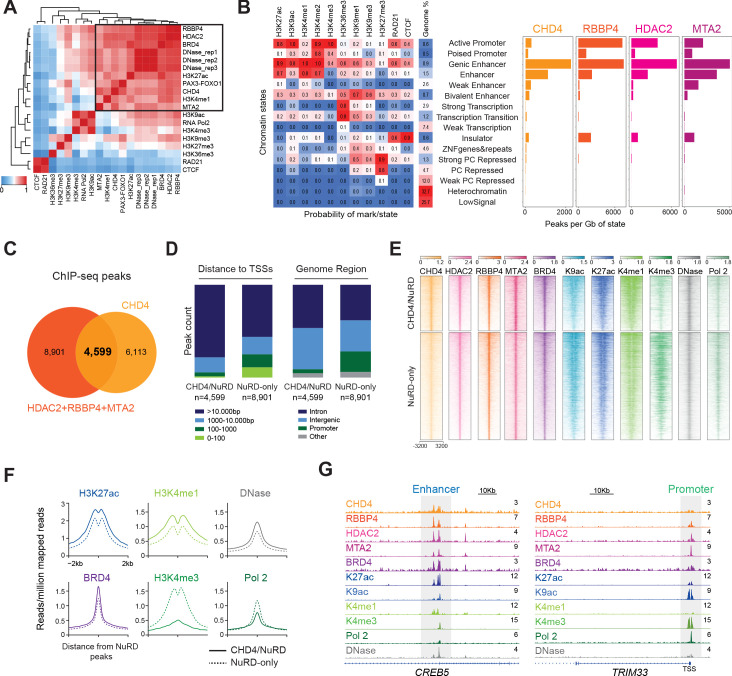
Figure 3. NuRD localizes to active chromatin with distinct compositions at enhancers and promoters.
(A) Pearson correlation heatmap of DNase I hypersensitivity (DNase) and ChIP-seq signal of the indicated epigenetic factors and histone marks in RH4 cells. Datasets are ordered by unsupervised clustering. (B) Chromatin states and respective abundance of the depicted NuRD components per state. (C) Overlap of CHD4, RBBP4, MTA2, and HDAC2 ChIP-seq peaks. (D) Distribution of the peak counts for CHD4/NuRD and NuRD-only regions according to their distance to the transcription start sites (TSSs) and genome functional region. (E) Heatmap depicting the ChIP-seq signal of the indicated NuRD subunits, BRD4, histone marks (H3K9ac,H3K27ac, H3K4me1, and H3K4me3), RNA Polymerase 2 (Pol 2), and DNase I hypersensitivity signal at CHD4/NuRD (n=4,599) and NuRD-only regions (n=8,901). The rows show 8kb regions, centered on HDAC2 peaks and ranked by the ChIP-seq signal intensity of H3K27ac. Color shading corresponds to ChIP-seq read counts. (F) Density plots displaying the average ChIP-seq signal of H3K27ac, H3K4me1, BRD4, H3K4me3, RNA Polymerase 2, and DNase I hypersensitivity signal at CHD4/NuRD and NuRD-only locations. (G) Examples of gene tracks displaying the ChIP-seq signal of the indicated proteins, histone marks and DNase I hypersensitivity signal at a CHD4/NuRD enhancer (CREB5) and a NuRD-only promoter (TRIM33).


