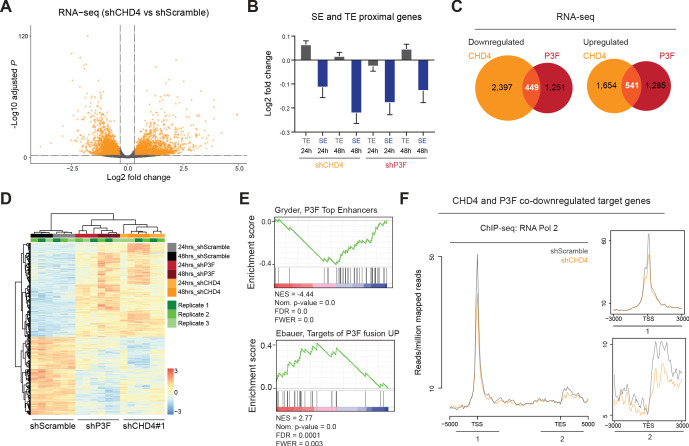
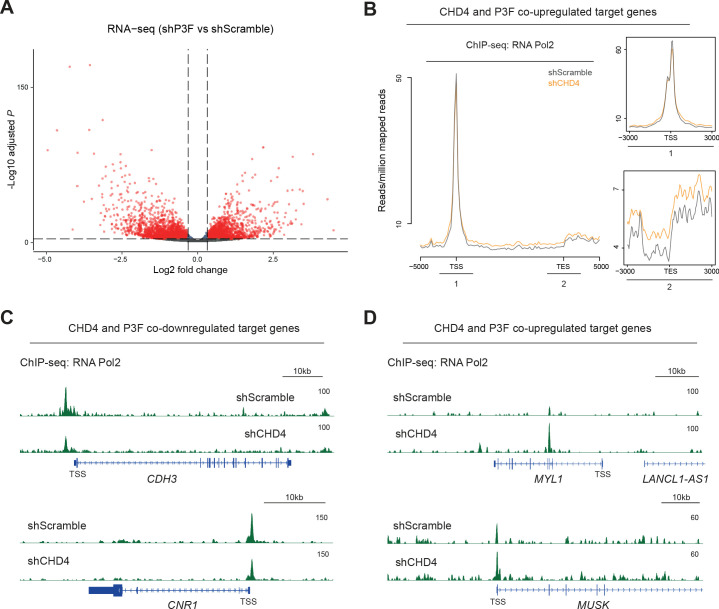
Figure 5. CHD4 regulates P3F- and SE-mediated gene expression as well as RNA Pol 2 binding to promoters.
(A) Volcano plot depicting changes in gene expression upon 48hrs of CHD4 silencing in RH4 cells (fold change≥ 25%, false discovery rate of 1%). (B) Changes in expression, as log2 fold change, of the nearest genes within TADs associated with typical enhancers and super-enhancers (TE and SE, respectively) in RH4 cells upon 24 or 48hrs of CHD4 or P3F silencing. Data are represented as mean ± SEM. (C) Overlap of CHD4 and P3F regulated genes identified by RNA-seq upon 48hrs of silencing. (D) Heatmap of unsupervised hierarchical clustering analysis depicting CHD4 and P3F co-regulated genes (n=990) in RH4 cells. (E) GSEA ontology analysis performed with the CHD4 and P3F co-regulated signature (n=990) as pre-ranked dataset. NES – normalized enrichment score, FDR – false discovery rate, FWER – family-wise error rate. (F) Density plots depicting the average RNA Pol 2 ChIP-seq signal upon 48hrs of CHD4 silencing (orange) at genes co-downregulated by P3F and CHD4 (n=449).


