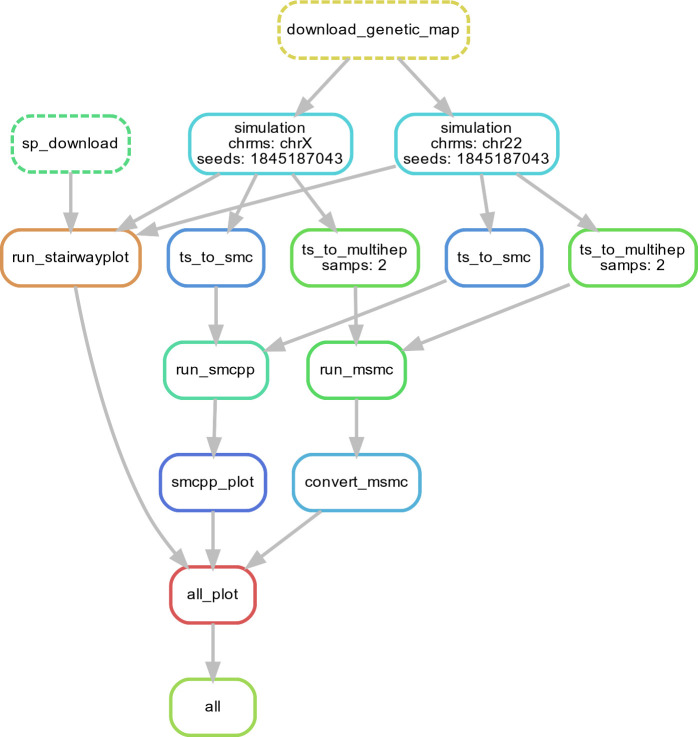
Appendix 1—figure 10. Workflow for our N(t) inference methods comparison.
Here, we show single replicate for two chromosomes, chr22 and chrX, simulated under the HomSap OutOfAfrica_3G09 demographic model, with a HapmapII_GRCh37 genetic map. Note that the data used as input by all inference methods smc++, MSMC, and stairway plot, come from the same set of simulations.

