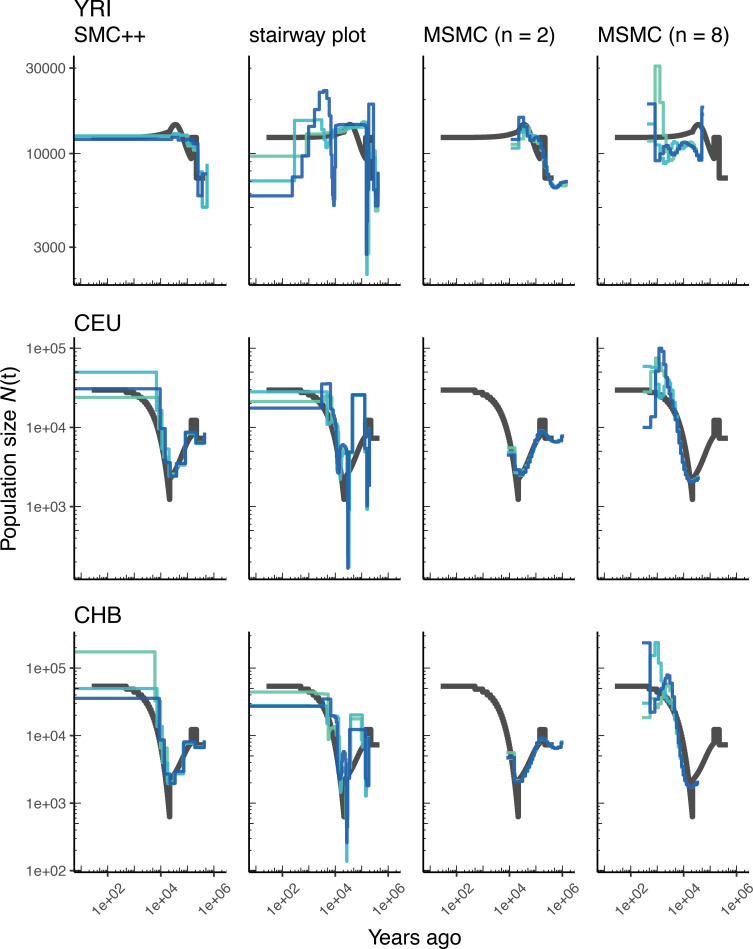
Appendix 1—figure 4. Comparing estimates of in humans.
Estimates of population size over time () inferred using four different methods, smc++, stairway plot, and MSMC with and . Data were generated by simulating replicate human genomes under the OutOfAfrica_3G09 model (Gutenkunst et al., 2009) and using the HapMapII_GRCh37 genetic map (Frazer et al., 2007). From top to bottom, we show estimates for each of the three populations in the model: YRI, CEU, and CHB. In shades of blue, we show the estimated trajectories for each replicate. As a proxy for the ‘truth’, in black we show inverse coalescence rates as calculated from the demographic model used for simulation (see text).

