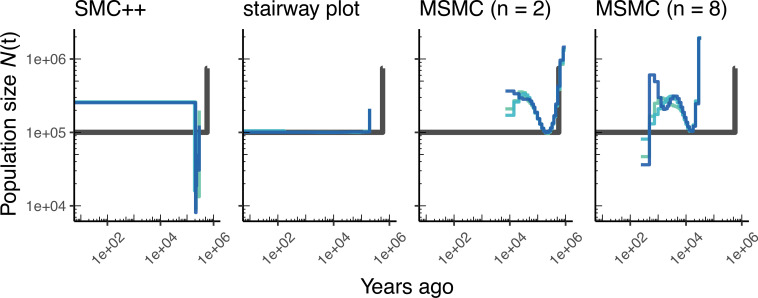
Appendix 1—figure 6. Comparing estimates of in A. thaliana.
Here, we show estimates of population size over time () inferred using four different methods, smc++, and stairway plot, and MSMC with and . Data were generated by simulating replicate A. thaliana genomes under the African2Epoch_1H18 model (Durvasula et al., 2017) and using the SalomeAveraged_TAIR7 genetic map (Salomé et al., 2012). As a proxy for the ‘truth’, in black we show inverse coalescence rates as calculated from the demographic model used for simulation (see text).

