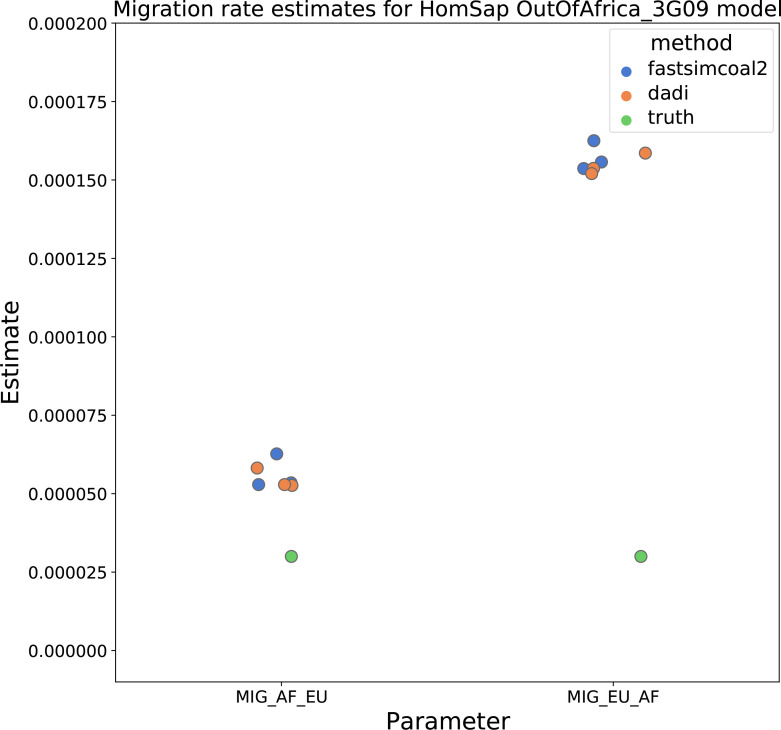
Appendix 1—figure 7. Migration rate estimates for the human Gutenkunst model.
Here, we show inferred migration rates from and fastsimcoal2. Data were generated by simulating replicate human genomes under the Gutenkunst et al., 2009 model and using the genetic map inferred in Frazer et al., 2007. Directional migration from Europe to Africa is represented as and migration from Africa to Europe is represented as . Note that the -axis coordinates are arbitrary.

