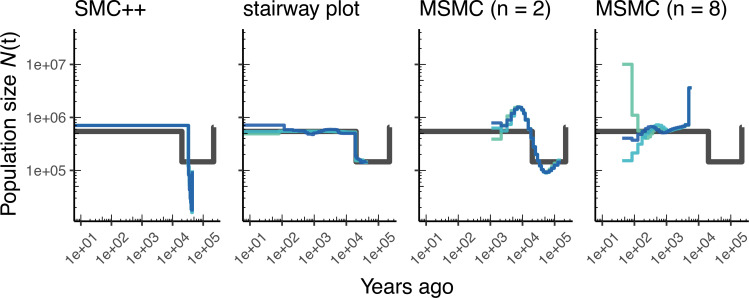
Figure 3. Comparing estimates of in Drosophila.
Population size over time () estimated from an African population sample. Data were generated by simulating replicate D. melanogaster genomes under the African3Epoch_1S16 model (Sheehan and Song, 2016) with the genetic map of Comeron et al., 2012. In shades of blue we show the estimated trajectories for each replicate. As a proxy for the ‘truth’, in black we show inverse coalescence rates as calculated from the demographic model used for simulation (see text).

