
Fig. 1. Dynamic network structure of PA and NA.
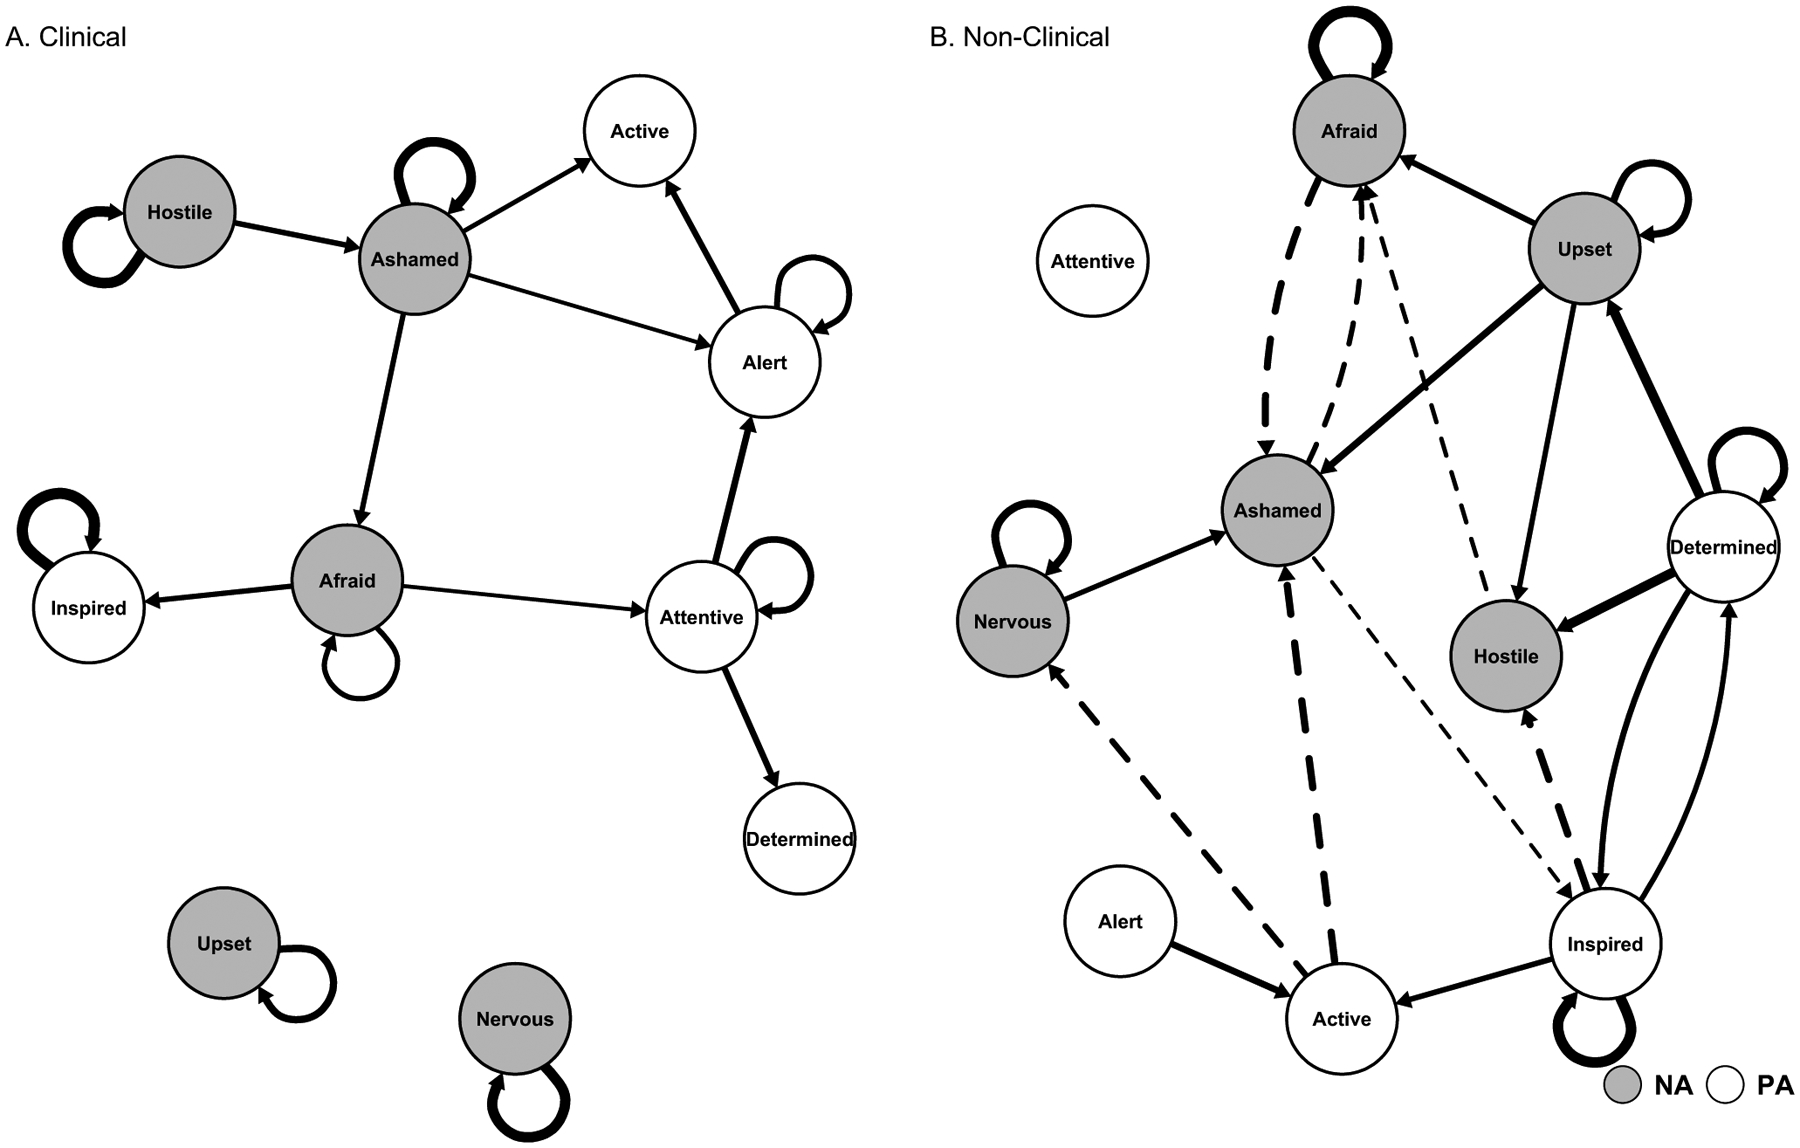
Note: In Figure 1A, positive directed edges emerged both within and between positive and negative affect nodes, suggesting temporal co-activation patterns characterize affective pathology. Fig. 1B reveals that positive directed edges are more frequent within nodes of a single valence than between oppositely valenced nodes. Thickness of arrow reflects strength of association. Solid arrows denote positive associations, whereas dashed arrows denote negative associations.