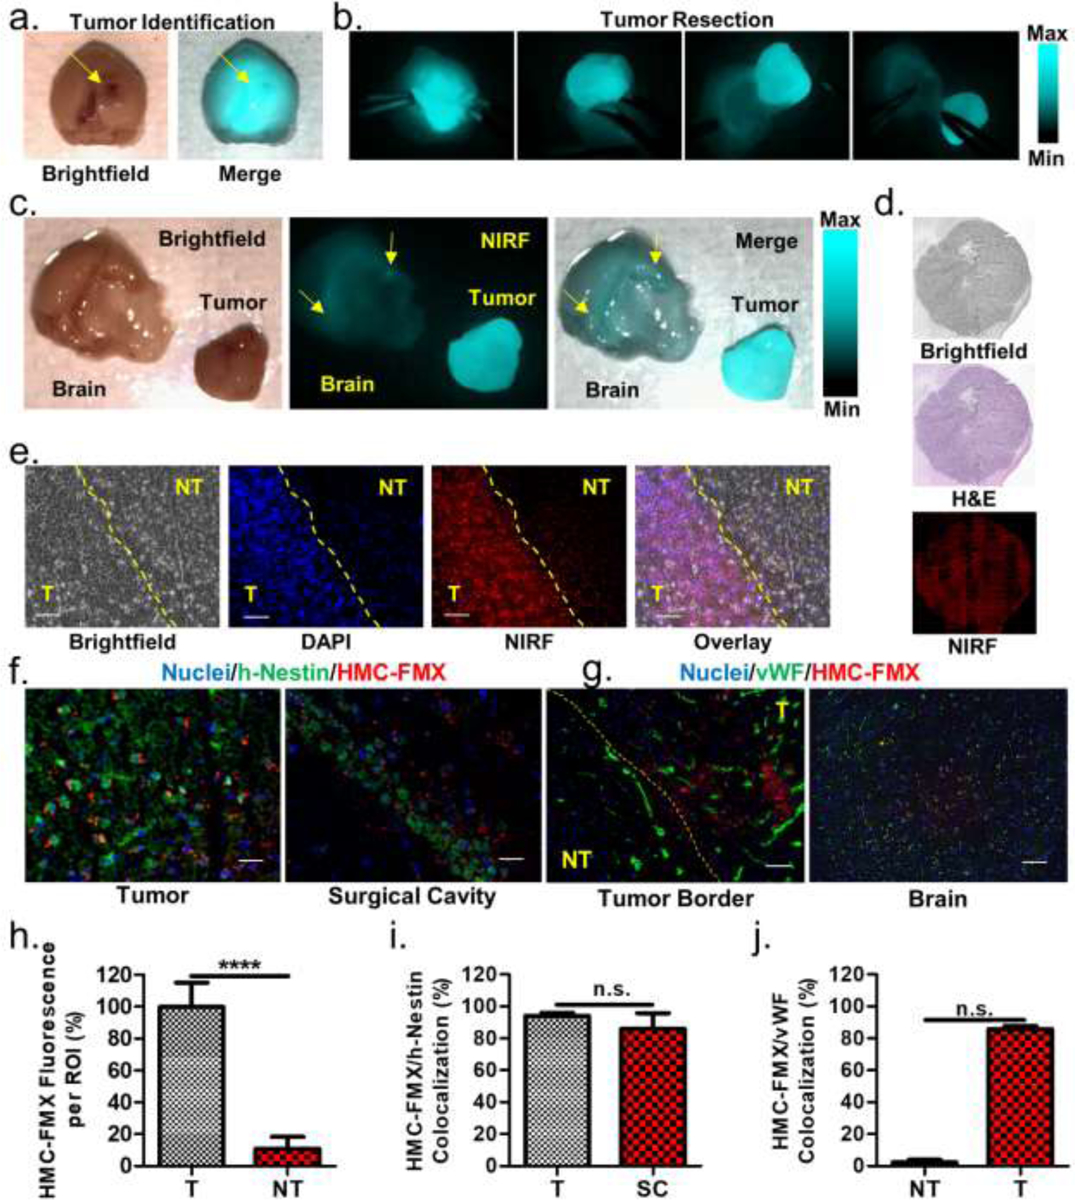
Figure 5. HMC-FMX crosses the BBB and targets orthotopic GBM tumors in mice.

Brightfield and merged brightfield/NIRF image of a mouse brain with a large GBM tumor (a). SIRIS-recorded snapshots of a tumor resection procedure (b). Brightfield, NIRF, and merged images of the brain and extracted primary GBM tumor (c). Fluorescence is observed both in the primary tumor and remaining in the surgical bed (yellow arrows). Microscopic images of brain tissue slices from HMC-FMX-treated GBM tumor-bearing mice. Significant correspondence is observed between H&E and HMC-FMX NIRF tumor identification methods (d). Magnified fluorescence images of the tumor border show correspondence between nuclear density and HMC-FMX NIRF tumor identification methods (e). The yellow line is a superimposed border based on brightfield images. Immunohistopathology of tumor and surgical bed indicate that HMC-FMX (red) associates with h-nestin (green) on U-87 cells (f). No association was observed between HMC-FMX (red) and von Willebrand factor (vWF) signal (green) on blood vessels in tumors, but significant association was observed in the normal brain (g). Quantification of HMC-FMX fluorescence in tumor (T) and non-tumor (NT) regions of part e (h), HMC-FMX/h-nestin co-localization in tumor (T) and surgical cavity (SC) of part f (i), and HMC-FMX/vWF co-localization in non-tumor (NT) and tumor (T) of part g (j). In each fluorescence microscope image, scale bars are 100 μm.
