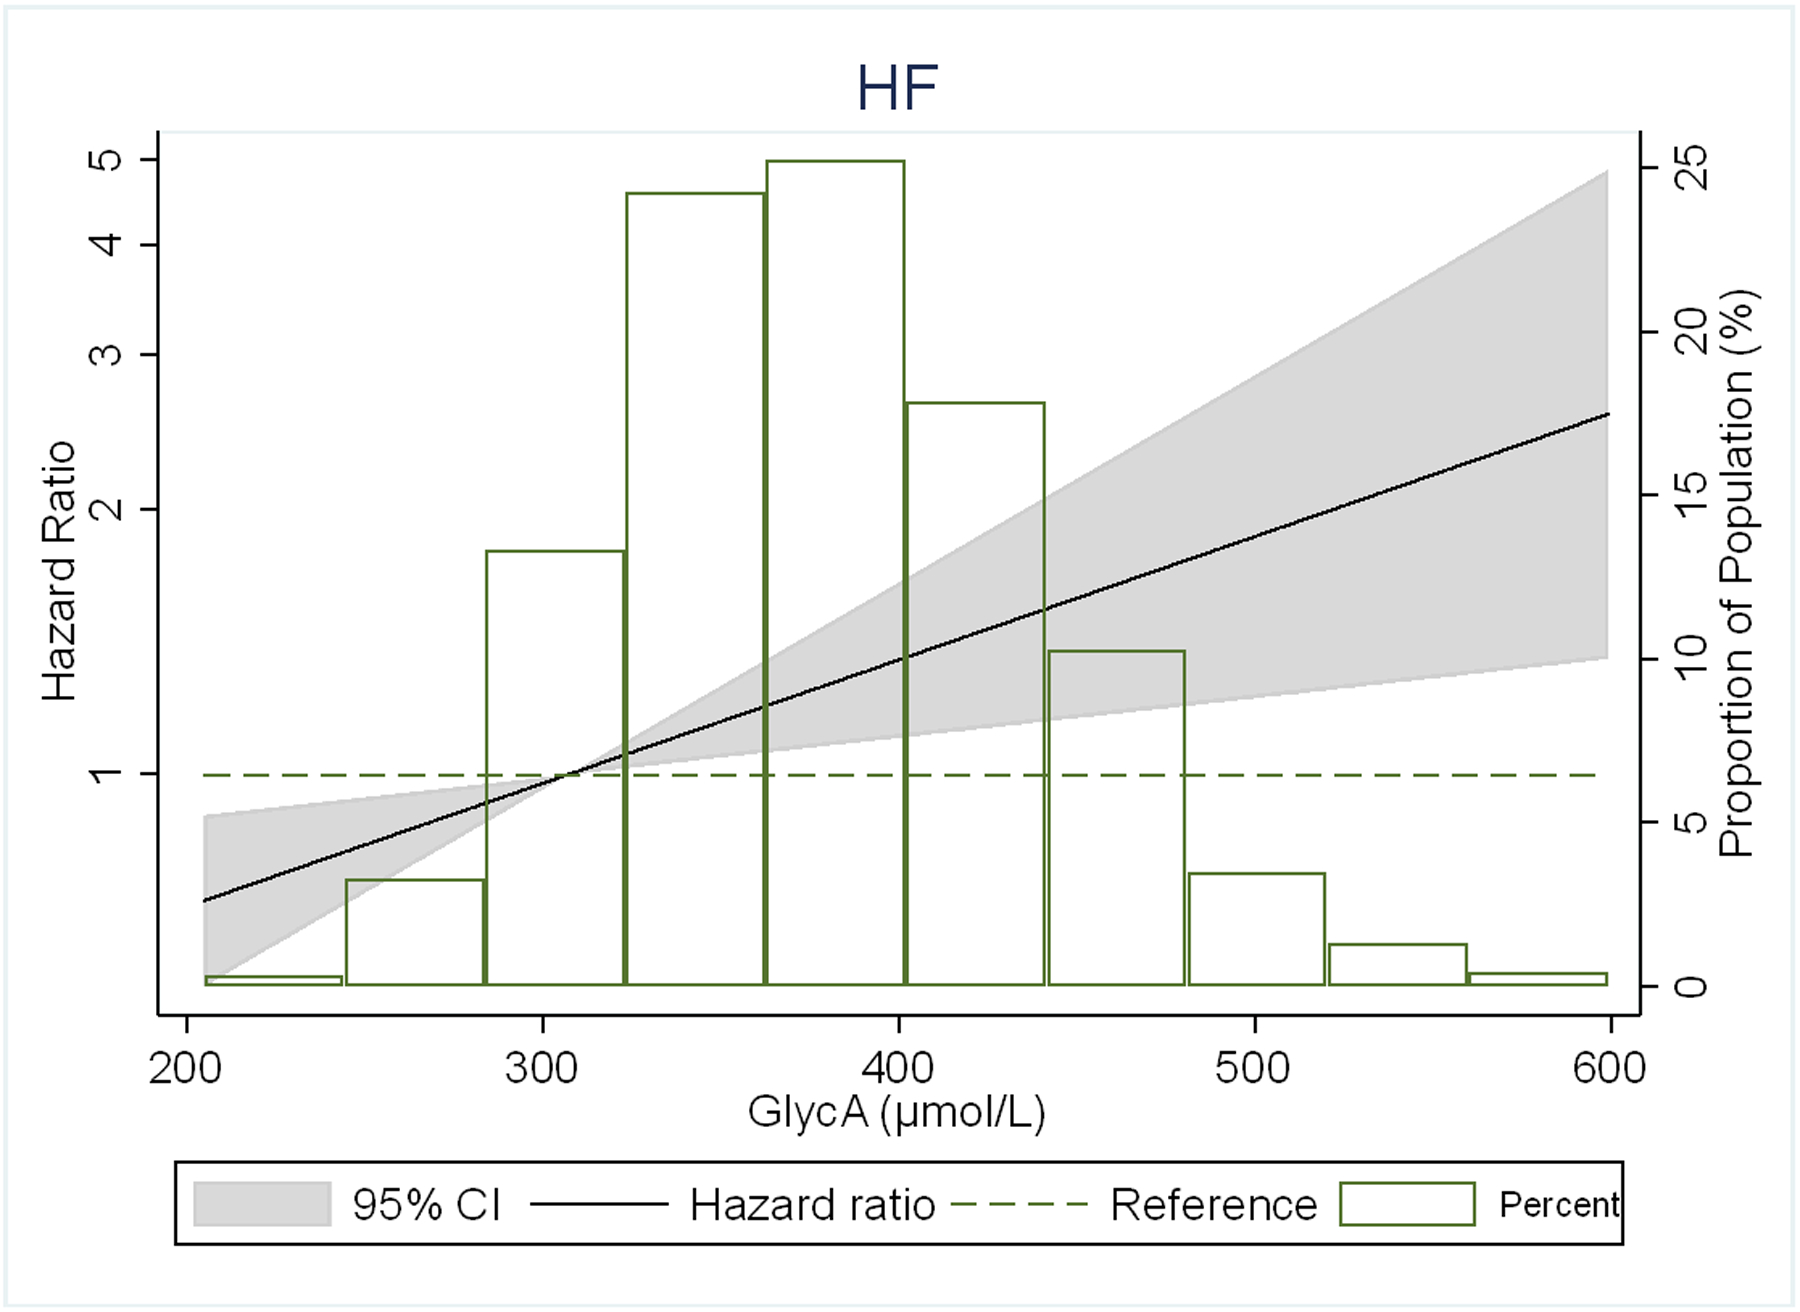
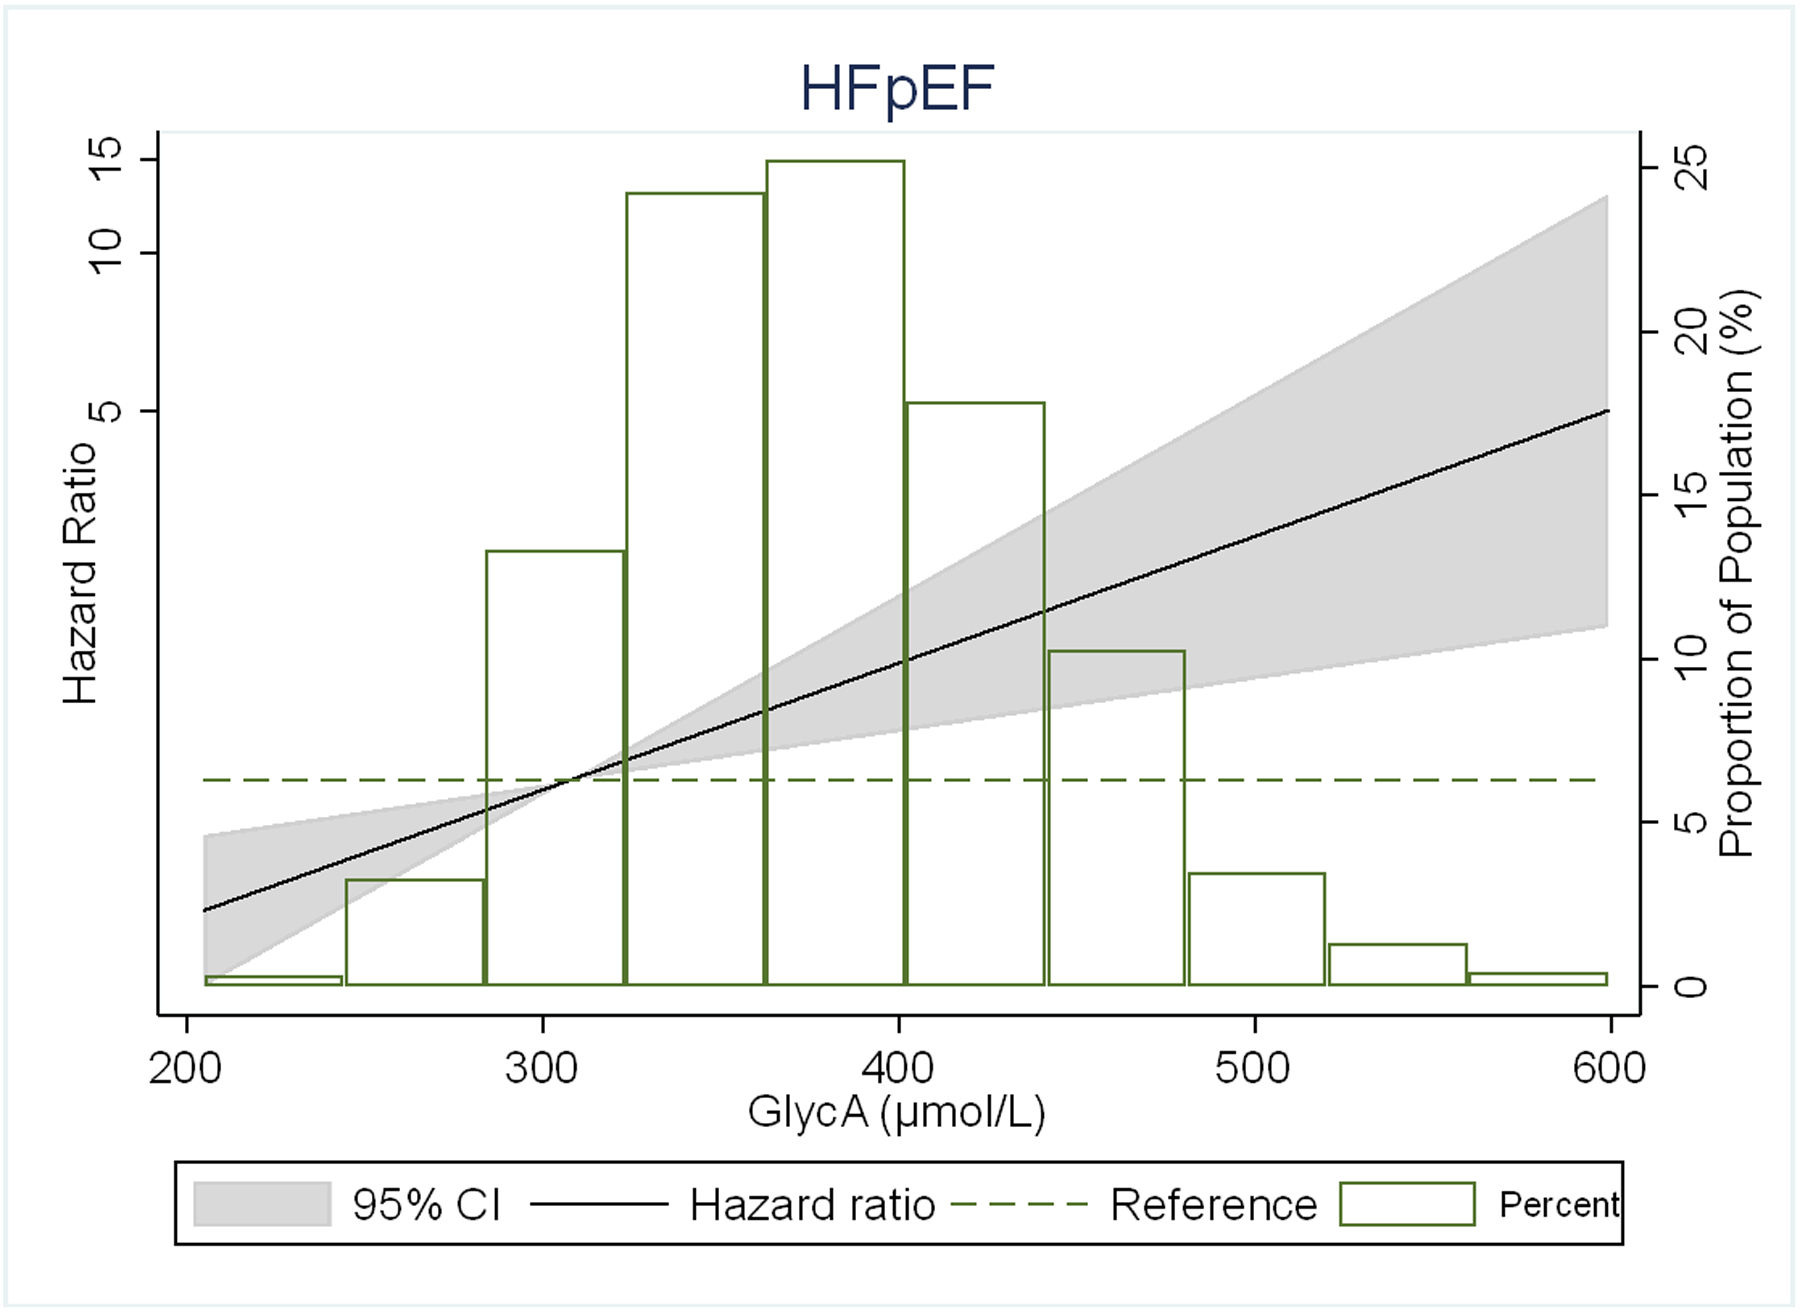
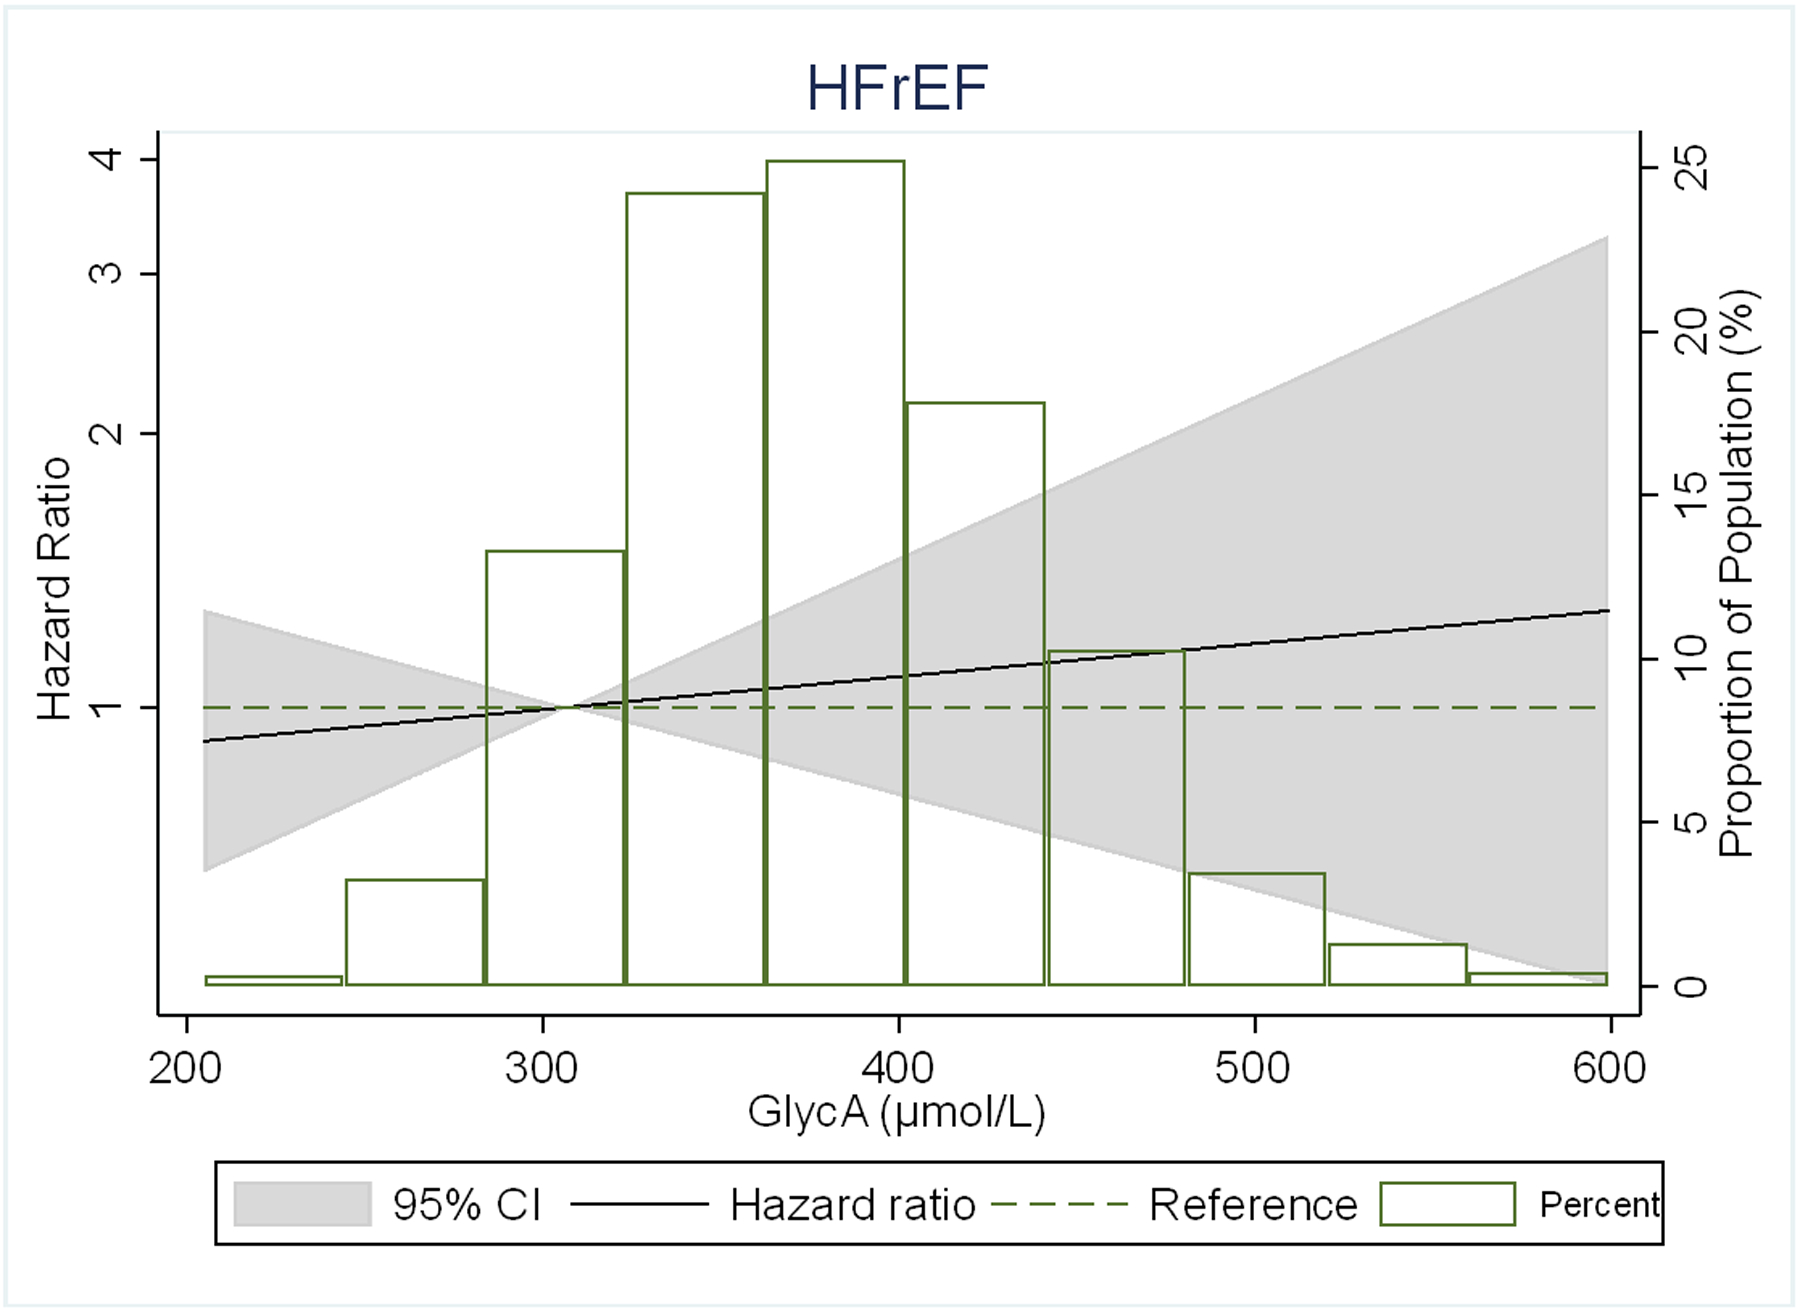
Figure 2.


Adjusted* restricted cubic spline models showing the association of GlycA levels with hazard ratio of (A) HF, (B) HFpEF, (C) HFrEF.
*Spline models adjusted for age, sex, and race/ethnicity, MESA site, education, health insurance, BMI, smoking status, pack-years of smoking, physical activity, systolic blood pressure, use of antihypertensive medication, total cholesterol, HDL- cholesterol, use of lipid-lowering medications, diabetes, eGFR, ln(CRP), ln(IL-6) and ln(Fibrinogen).
The 4 knots are at 5th, 25th, 65th and 95th percentiles. Black curves represent the HR for the type of HF by proportion of population with the respective GlycA concentration. The 95% CI is represented by the gray shadow.
