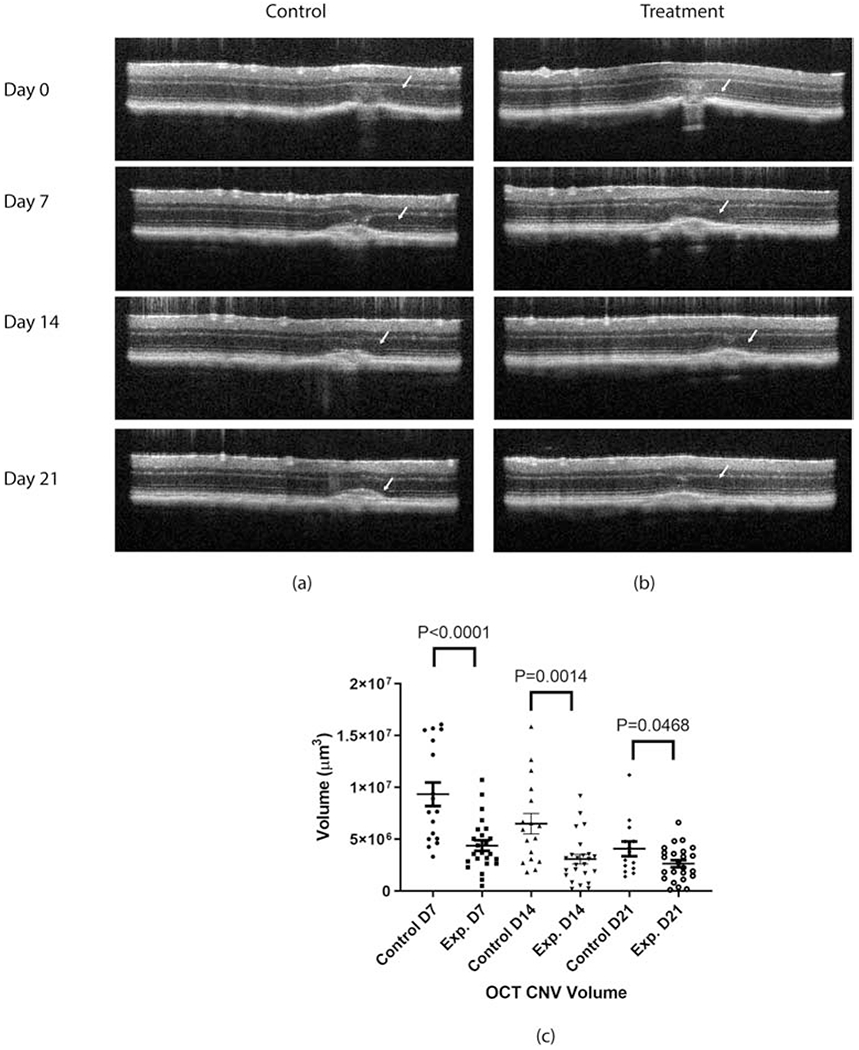
Figure 4:

OCT – CNV volume representative scans of (a) control, (b) experimental mouse on all follow-up time points (i.e. day 7, 14 and 21), and (c) statistical comparison of OCT based CNV volume measured on day 7, 14, and 21 after laser injury. N=17 for controls and n=24 for experimental at each time point.
