
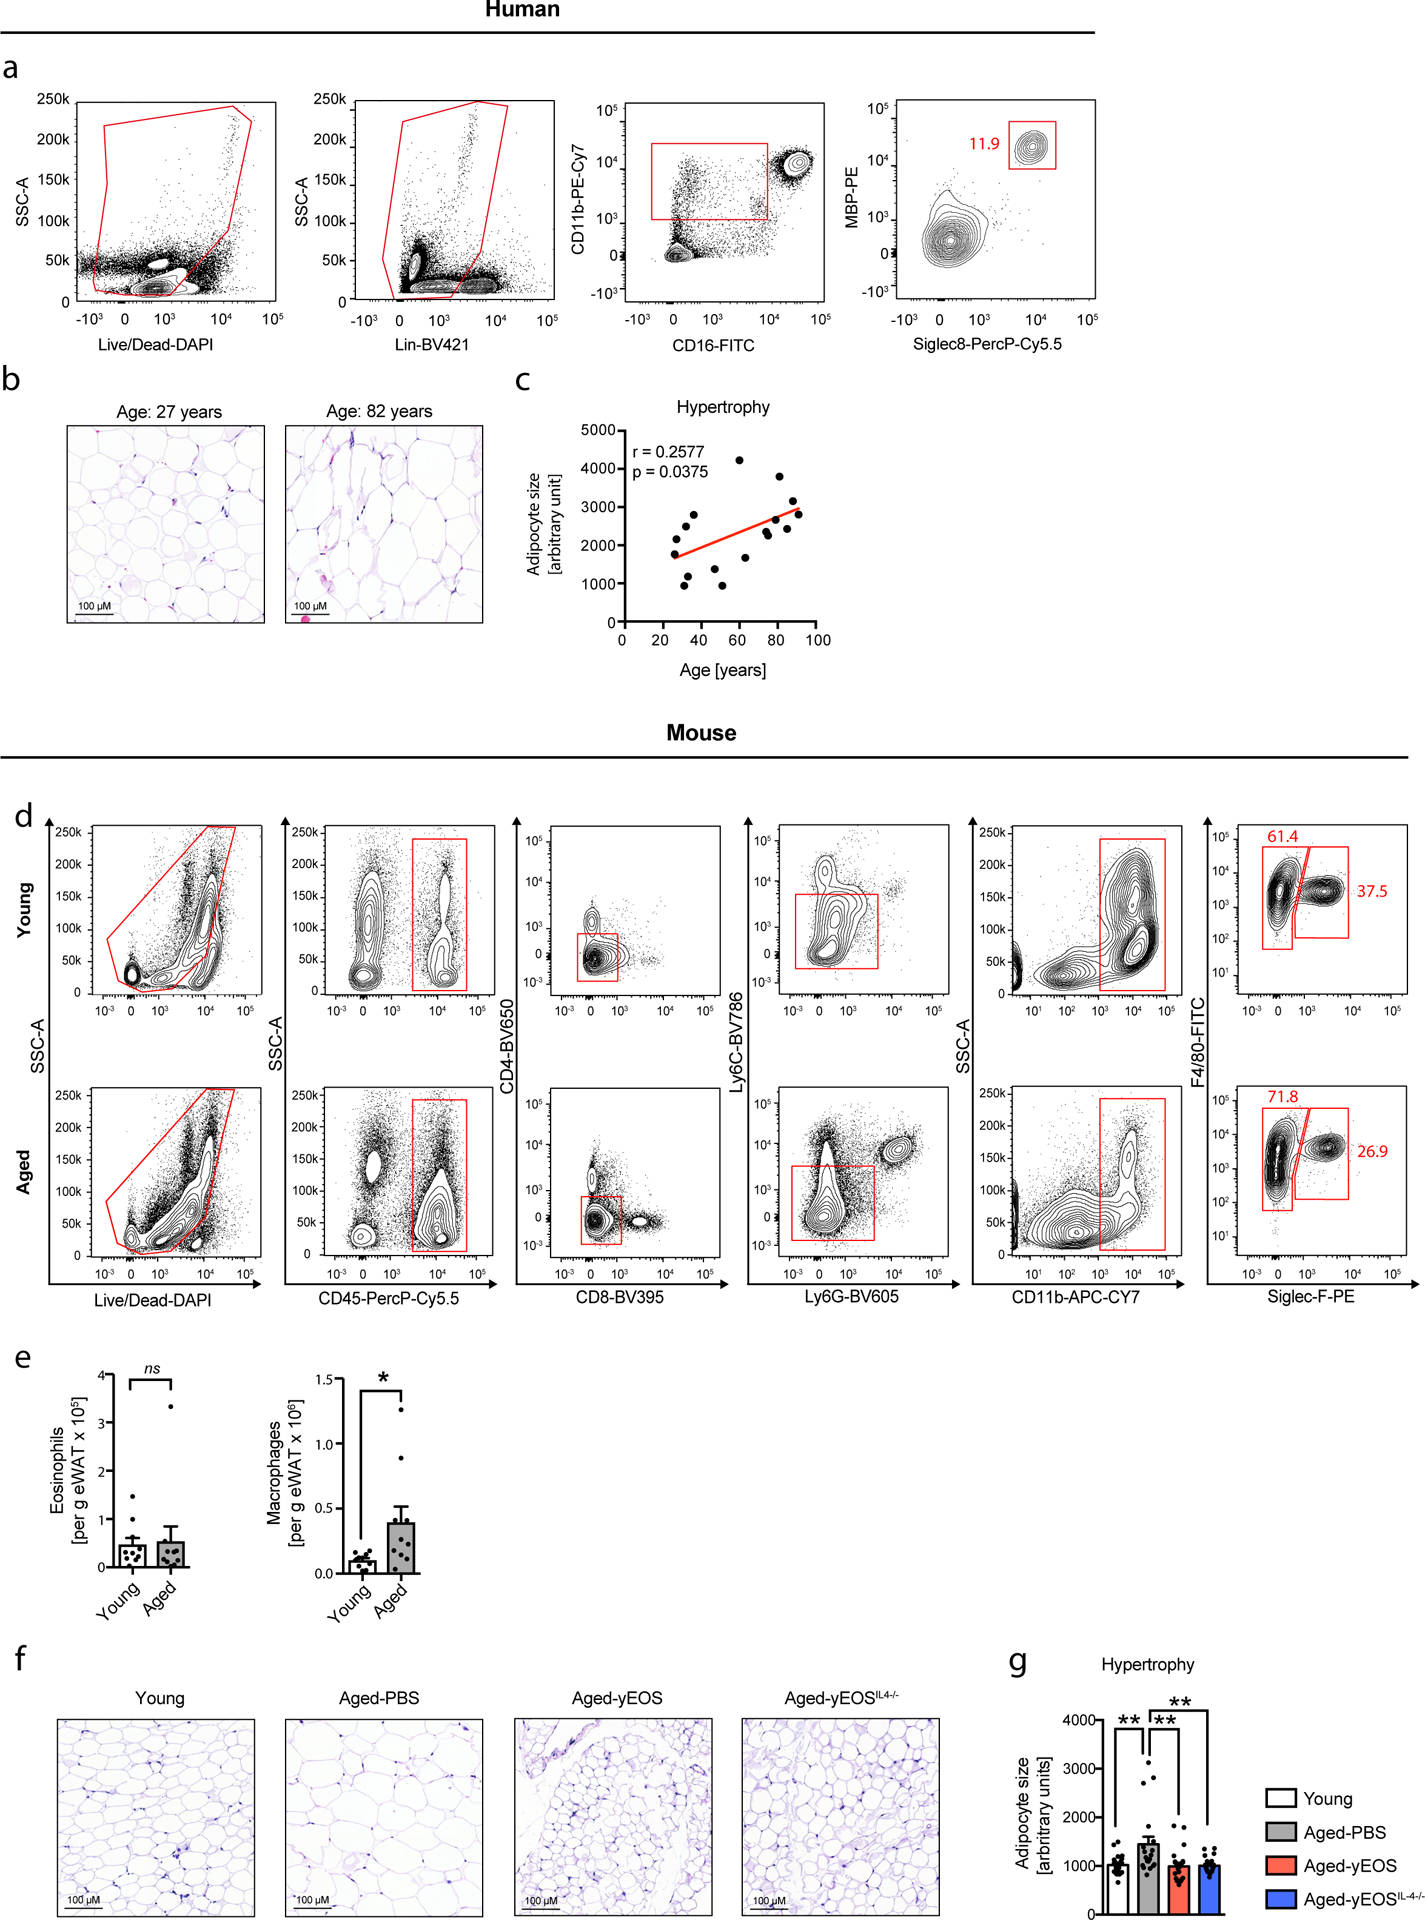
Extended Data Fig. 2. Gating strategies for human and mouse ATEs and age-related adipose tissue hypertrophy.
(a) Experimental protocol. (b) Frequencies of eosinophils, macrophages and calculated eosinophil:macrophage ratios in eWAT of Aged-PBS (n=8) and Aged-yNEU (n=9) mice. (c) mRNA expression levels for Tnfα, Il1β and IL6 in eWAT of Aged-PBS (n=8) and Aged-yNEU mice (n=9). Data are presented as fold induction over Aged-PBS controls. (d) Average time on Rotarod of Aged-PBS controls (n=8) and Aged-yNEU mice (n=9). (e) Total numbers of lin–, Sca-1+, c-kit+ hematopoietic stem cells (LSKs) in Aged-PBS (n=4) and Aged-yNEU (n=4) mice. (f) Numbers of common myeloid progenitors (CMP), common lymphoid progenitors (CLP), and granulocyte/monocyte progenitors (GMP) in the bone marrow of Aged-PBS (n=4) and Aged-yNEU (n=4) mice. (g) Frequencies of neutrophils in eWAT of young (n=5), Aged-PBS (n=4) and Aged-yNeu (n=5) mice. (h) Experimental protocol of bone marrow derived eosinophil (BMDE) transfers. (i) Calculated ATE:ATM ratios in eWAT of Aged-PBS (n=5) and Aged-BMDE (n=4) mice as measured by flow cytometry. (j) IL-6 protein levels in eWAT of Aged-PBS (n=6) and Aged-BMDE (n=5) mice. (k) Pre- and post-treatment IL-6 plasma protein levels in Aged-PBS (n=6) and Aged-BMDE (n=5). (l) Intra-group and (m) inter-group comparison of pre- and post-treatment average time on wheel (Rotarod test) in Aged-PBS (n=6) and Aged-BMDE (n=5) mice. Delta in performances in (l) is calculated relative to baseline (post- minus pre-treatment results). Statistical significance was calculated by Wilcoxon matched pairs signed rank test (k, l), by unpaired two-tailed Student’s t test (b, c, d, e, f, I, j, m) or by one-way ANOVA followed by two-tailed post-hoc Dunnett’s multiple comparison test against the aged-PBS treated group (g). Data are pooled from two independently performed experiments (except for (g-m) only one experiment has been performed) and shown as individual data points with mean ± SEM. Data are shown as mean ± SEM. *p < 0.05, **p < 0.01.