
Extended Data Fig. 4. Transfer of neutrophils to aged mice does not alter WAT inflammation, hematopoetic stem cell pol or physical performance.
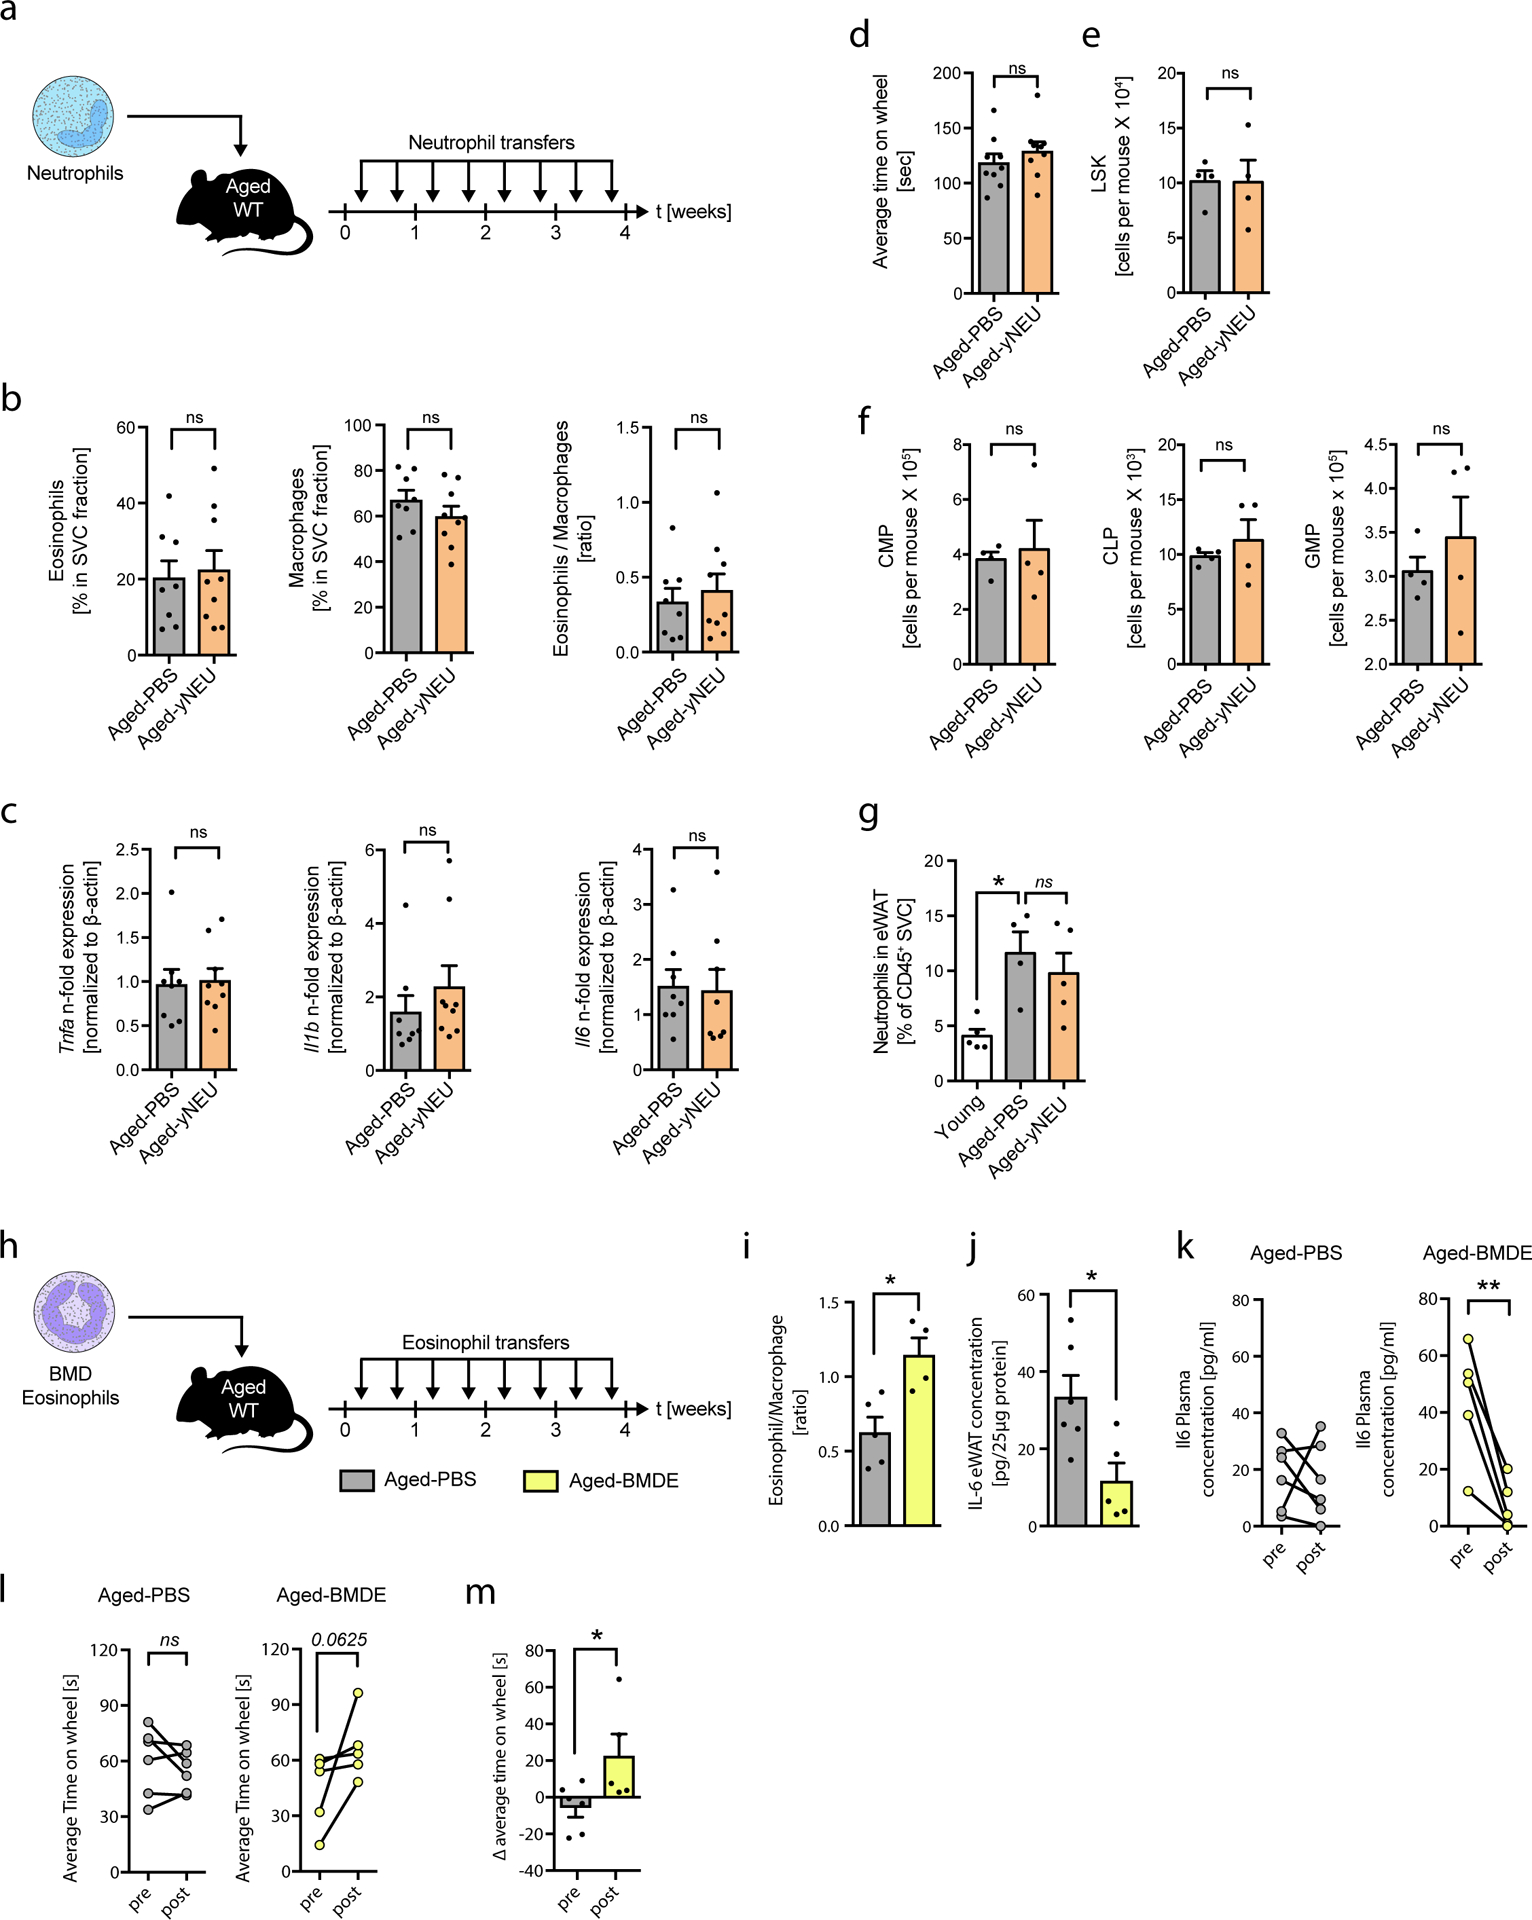
(a) Experimental protocol. (b) Frequencies of eosinophils, macrophages and calculated eosinophil:macrophage ratios in eWAT of Aged-PBS (n=8) and Aged-yNEU (n=9) mice. (c) mRNA expression levels for Tnfα, Il1β and IL6 in eWAT of Aged-PBS (n=8) and Aged-yNEU mice (n=9). Data are presented as fold induction over Aged-PBS controls. (d) Average time on Rotarod of Aged-PBS controls (n=8) and Aged-yNEU mice (n=9). (e) Total numbers of lin–, Sca-1+, c-kit+ hematopoietic stem cells (LSKs) in Aged-PBS (n=4) and Aged-yNEU (n=4) mice. (f) Numbers of common myeloid progenitors (CMP), common lymphoid progenitors (CLP), and granulocyte/monocyte progenitors (GMP) in the bone marrow of Aged-PBS (n=4) and Aged-yNEU (n=4) mice. (g) Frequencies of neutrophils in eWAT of young (n=5), Aged-PBS (n=4) and Aged-yNeu (n=5) mice. (h) Experimental protocol of bone marrow derived eosinophil (BMDE) transfers. (i) Calculated ATE:ATM ratios in eWAT of Aged-PBS (n=5) and Aged-BMDE (n=4) mice as measured by flow cytometry. (j) IL-6 protein levels in eWAT of Aged-PBS (n=6) and Aged-BMDE (n=5) mice. (k) Pre- and post-treatment IL-6 plasma protein levels in Aged-PBS (n=6) and Aged-BMDE (n=5). (l) Intra-group and (m) inter-group comparison of pre- and post-treatment average time on wheel (Rotarod test) in Aged-PBS (n=6) and Aged-BMDE (n=5) mice. Delta in performances in (l) is calculated relative to baseline (post- minus pre-treatment results). Statistical significance was calculated by Wilcoxon matched pairs signed rank test (k, l), by unpaired two-tailed Student’s t test (b, c, d, e, f, I, j, m) or by one-way ANOVA followed by two-tailed post-hoc Dunnett’s multiple comparison test against the aged-PBS treated group (g). Data are pooled from two independently performed experiments (except for (g-m) only one experiment has been performed) and shown as individual data points with mean ± SEM. Data are shown as mean ± SEM. *p < 0.05, **p < 0.01.