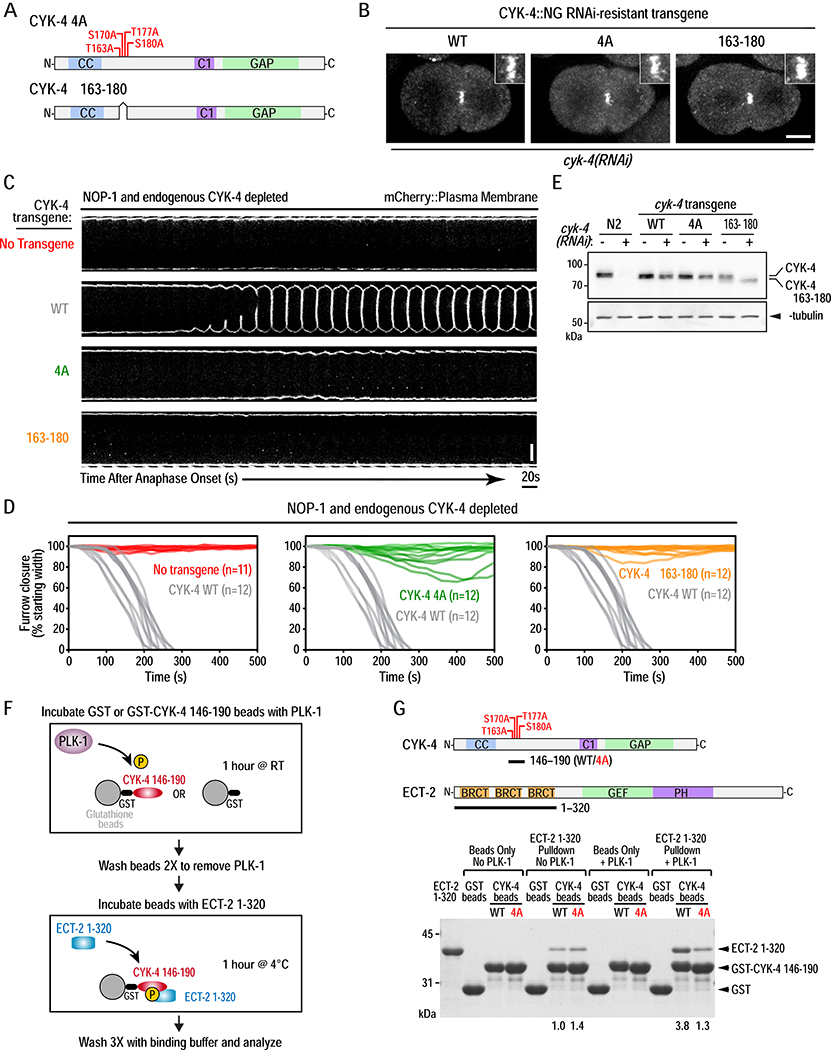
Figure 3. PLK-1 phosphorylation the CYK-4 N-terminus promotes its binding to the ECT-2 BRCT repeat domain and is essential for cytokinesis.
(A) Schematics of the CYK-4 4A and Δ163–180 mutants. (B) Stills from timelapse sequences of embryos expressing NeonGreen fusions with WT, 4A, or Δ163–180 CYK-4 following endogenous CYK-4 depletion. Images shown are 200 seconds after anaphase onset. Insets are magnified 3X. Scale bar, 10μm. (C) Images of the furrow region from timelapse sequences of embryos expressing an mCherry::plasma membrane marker for the indicated conditions. Scale bar, 10μm. (D) Plots of the kinetics of contractile ring closure in individual embryos for the conditions shown in (C). The WT CYK-4 control traces are shown in gray on all three graphs. (E) Immunoblot of extracts prepared from the indicated strains in the absence (−) or presence (+) of endogenous CYK-4 depletion. α-tubulin as a loading control. (F) Schematic of the protocol for analysis of PLK-1 phosphorylation promoted binding of CYK-4 to ECT-2. (G) Schematics of CYK-4 146–190 (WT or 4A mutant) and ECT-2 1–320 proteins used in the pulldown assay (top) and analyzed by SDS-PAGE and Coomassie staining (bottom). Numbers below lanes indicate amount of ECT-2 1–320 pulled down, relative to the amount pulled down by unphosphorylated WT CYK-4 fragment. See also Figure S4 and Video S3.

