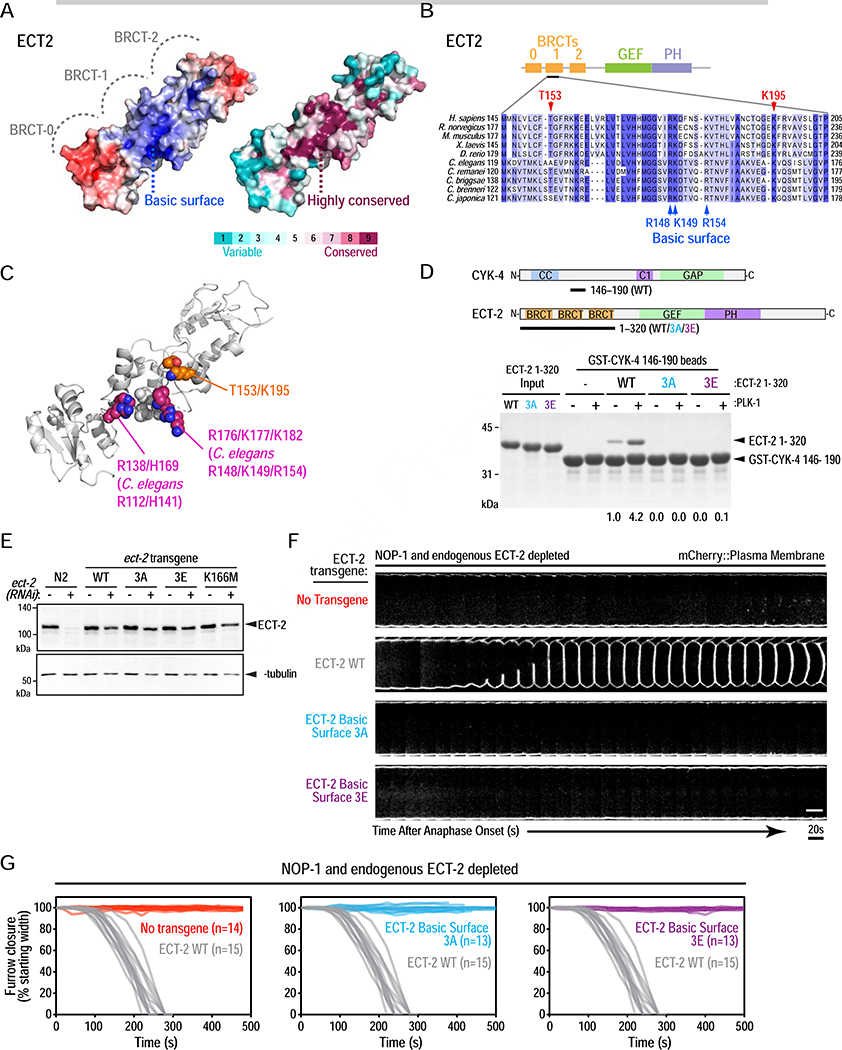
Figure 5. A conserved basic surface in the ECT-2 BRCT module mediates interaction with PLK-1 phosphorylated CYK-4 and is essential for cytokinesis.
(A) Surface representations of the triple BRCT repeat module of human ECT2 (PDB:4n40) colored by electrostatic potential (left: blue: positive; white: neutral; red: negative) or conservation across 150 homologs (right). (B) Sequence alignment of the indicated region of the ECT2 BRCT-1 repeat. (C) Structure of the human ECT2 BRCT repeat module highlighting the “canonical phospho-recognition” residues T153 and K195 as orange/red/blue spheres and the residues that comprise the basic surface as magenta/blue spheres. The residues in the center of the surface (T123, S146 and V147 in C. elegans and V149, V174, I175 in human) are shown in light gray spheres. The side chains of K177 and K182, which are disordered in the crystal structure, were modeled into PDB:4n40. (D) (top) Schematics of proteins used in the pulldown assay, conducted as in Figure 3F. (bottom) Pulldown results analyzed by SDS-PAGE and Coomassie staining. Numbers below lanes indicate amount of ECT-2 1–320 pulled down, relative to the amount pulled down by unphosphorylated WT CYK-4 fragment. (E) Immunoblot of the indicated worm extracts. α-tubulin serves as a loading control. (F) Analysis of furrow ingression for the indicated conditions, done as in Figure 3C. Scale bar, 10 μm. Scale bar, 10μm. (G) Plots of the kinetics of contractile ring closure in individual embryos for the conditions shown in (F). The control WT ECT-2 traces are shown in gray on all three graphs. See also Figure S6 and Video S3.

