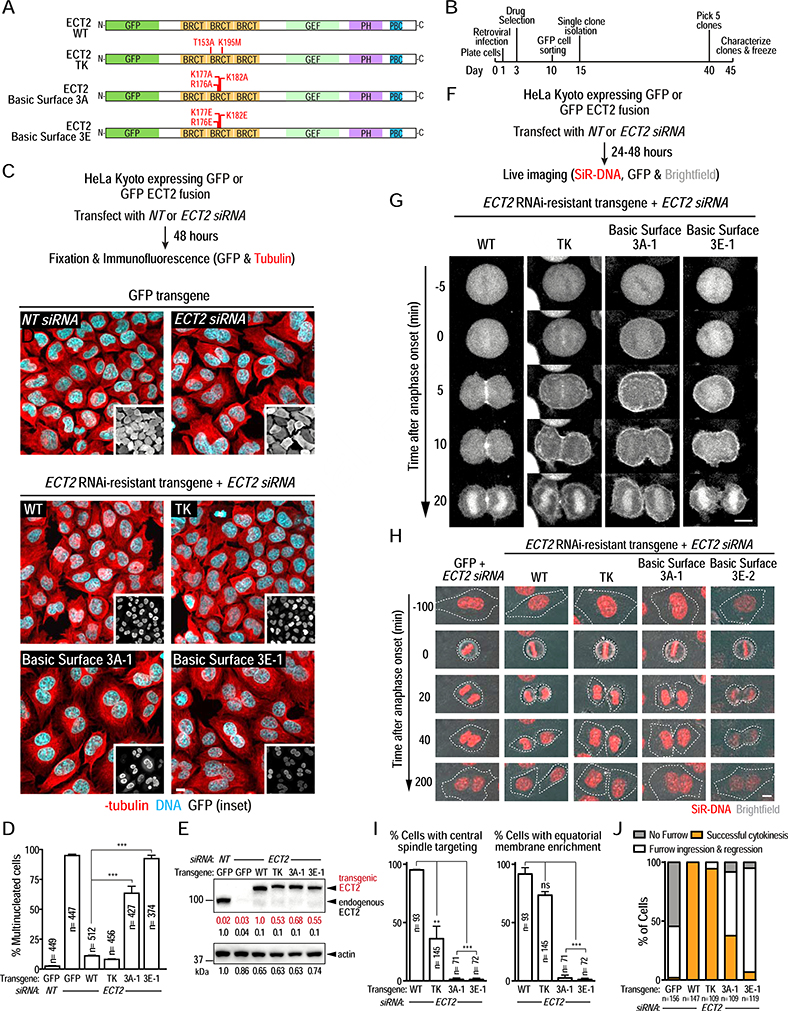
Figure 6. The conserved basic surface on the ECT2 BRCT module is essential for cytokinesis in human cells.
(A) Schematics of GFP-tagged ECT2 proteins expressed in human cells. (B) Outline of the procedure used to generate stable clonal HeLa Kyoto cell lines expressing GFP alone or GFP fusions with WT or mutant ECT2. (C) (top) Schematic outlining the experimental protocol used to analyze fixed HeLa Kyoto cell lines expressing GFP or GFP-ECT2 fusions after endogenous ECT2 depletion. (middle) Representative images of fields of cells expressing GFP after transfection with non-targeting (NT, left)) or ECT2 siRNA (right). (bottom) Representative images of fields of cells expressing the indicated GFP-ECT2 fusions after depletion of endogenous ECT2. Scale bar, 10 μm. (D) Plot of the percentage of multinucleated cells from the experiment in C (mean ± SE). Bars represent mean values of three independent experiments. n represents the total number of cells scored for each condition. On average, 150 cells were scored in each experiment. (E) Immunoblot analysis of the indicated lysates prepared 48 hours after transfection with non-targeting or ECT2 siRNA. Actin serves as a loading control. (F) Schematic of the protocol used to conduct live imaging. (G) Stills from timelapse sequences of GFP-ECT2 fusions in the indicated cell lines after depletion of endogenous ECT2. Cells were imaged 24 hours after ECT2 siRNA transfection. Time 0 is anaphase onset. (H) Images showing cytokinetic phenotypes for the indicated conditions after depletion of endogenous ECT2. Cells were labeled with SiR-DNA and overlays of brightfield and DNA signals are shown. The metaphase-to-anaphase transition is t=0 min. Dashed white lines mark cell boundaries. Scale bar, 10 μm. (I) Quantification of the experiment in G. The percentage of cells in which the indicated GFP-ECT2 fusion accumulated at the central spindle (left graph) or was enriched on the equatorial membrane (right graph) is shown. Bars represent mean values of two independent experiments; error bars are the SE. n is the total number of cells scored for each condition. (J) Quantification of cytokinetic phenotypes from the experiment in H. Phenotypes were scored between 24 and 48 hours after siRNA transfection. See also Figure S7 and Videos S4 & S5.

